A few months ago I was at the ClickTale Forum, an amazing ClickTale customer event in NYC. At the event I got a chance to have many interesting discussions; a theme that repeated in some of them was customers’ concern of adding third-party services to their sites. Who can blame those customers? It is widely known that faster load times benefit both conversions and search engine ranking. When adding more and more third-party services, marketing departments start getting red lights from their technical departments.
This issue is something that I have to deal with a lot in my role as ClickTale CTO but also prior to that. I often represent both sides of this “debate”, being responsible for IT of our own sites and for providing the ClickTale service to our customers in a way that would minimize any effect on their websites. Measuring such effect turns out to be much more complex than seems to be initially. Unfortunately, the way that is often used to measure page load time is too simplified and doesn’t really measure what matters. In this article I will explain the page life cycle, will tell you about the only definite way I know of measuring page load time (with a case study) and then using this new acquired understanding to discuss and analyze third-party effects on your site.
“Closing credits”, we shouldn’t care about them
Most of you probably don’t stick around to watch the closing credits of a movie when the movie is over. When the credits start, you change a channel or get out of the movie theater. It is true that a movie’s runtime includes the credits in the end, but we usually don’t care about them. The effective movie runtime for us is when actors stop acting, the story ends and credits start. Similarly, when the page loads in a browser and we can start reading it and interacting with it, why should we care about any additional loading? We shouldn’t! How does this apply to web pages? Let’s understand a page’s life cycle first.
Page life cycle
This is the process an HTML page goes through in a browser when it loads (simplified for our discussion, sequence might change for outliers).
- Request to a page is made
- HTML time to first byte – browser gets “First byte” of the HTML page
- Browser starts loading external resources such as js and css
- HTML content download – browser gets the entire HTML of the page
- Start render – browsers starts showing the page on the screen
- Browser loads more external resources including pictures
- 90% above fold visibility – browser achieves almost final (to be determined by you) view of the area above the fold
- Document complete (AKA domload) – browser loads all js and css that are referenced directly in the HTML and runs them
- Browser loads more external resources specifically pictures and requests that are result of domload code
- Fully loaded (AKA load) – browser loads all js, css and images that are referenced directly in the HTML and executes them
- Browser loads any after load code, such as AJAX requests, etc.
- Visually complete – the page achieves a final, static form (assuming no interactions and no timed animations)
Wow! Quite a lot of things happening. I will soon discuss which of these events we should measure and how?
Why should we care about the different events?
Any effect of a third-party component depends greatly on where the third-party is located in the page life cycle. Per the movie analogy, if you have sound problems in the closing credits, it is not the same as bad sound in a fascinating car chase scene.
One key thing to know is if your third-party is responsible for getting your page rendered or if it only active after the page is rendered.
How to measure?
Out of the events of the cycle, only few can be measured easily on the client side (start, domload and load). Some analytics services (for example ClickTale) can measure those continuously while tracking visitors. Other few events are only measurable on the server side or by external tools.
There is only one way that I know and recommend that can give you the full picture of the loading process. Measure your pages with webpagetest.org ! WebPagetest is the best! You have to use WebPagetest. WebPagetest is free and open source where it’s development is supported by Google. WebPagetest.org is an online version of WebPagetest that is ran by Web Performance Optimization Foundation and partners operating test locations for the benefit of the community. Have I mentioned already that you need to use WebPagetest? 😉
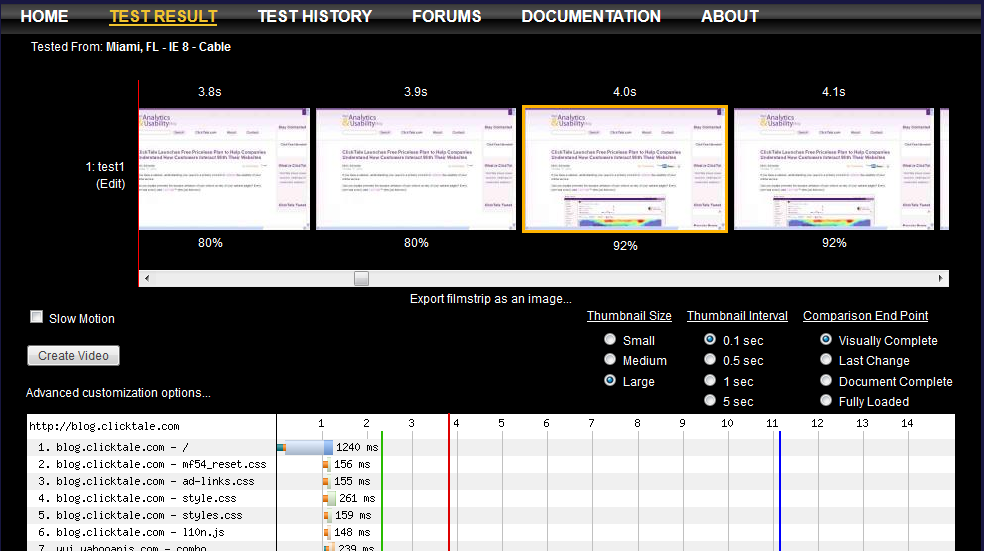
The reason I am putting so much emphasis on WebPagetest is because of its ability to track and measure the rendering process and not just the resource waterfall chart (it does that, too).
What to measure?
The metrics you will measure will depend on why you are measuring in the first place. If you are trying to resolve a specific choke point you will focus on that, however, usually what you are trying to improve is overall user experience. When measuring user experience you should measure and track your “90% above fold visibility” because that is what a human experiences. A human visitor doesn’t experience a “domload” event. Well, maybe a few cyborgs do but we can agree that most humans don’t.
The “90%” is configurable. If you want, you can choose another number that you believe will fit your case better. Perhaps someday someone will do or find a more elaborate scientific research on this subject. For now, I suggest not to got for 100% since it will mean you require each and every icon, button and picture to load before the page will be worthy for a person to start reading it, and this is an exaggeration.
Measuring blog.clicktale.com – case study
To demonstrate the above, I ran a WebPagetest.org test on blog.clicktale.com. ClickTale’s blog is a typical blog with images, videos, social buttons and analytic providers. The blog is not super-optimized, but also not a terrible one. Here are the results:
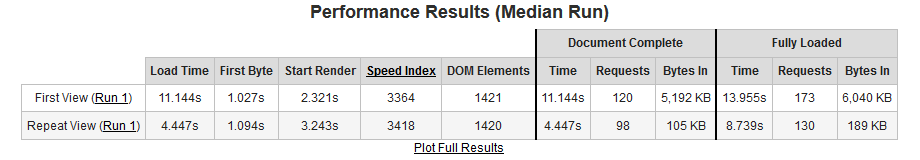
It is normal to expect a faster load on a repeat view since some of the resources are already present in cache.
Let’s follow the pageview life cycle using the metrics above.
- At 1.027 sec first byte is received
- At 2.321 sec rendering starts
- At 4 sec we reach more than 90% above fold visibility
- At 11.114 sec load and document complete events fire
- At 13.955 sec all resources have loaded and page achieved static form
As can be seen, there is a big difference between when a page is visually displayed (around 4 sec) and when technical events in the browser fire (around 11 sec).
Analyzing third-parties on blog.clicktale.com – case study
Once we have identified the point in time where we have satisfactory visual completeness, this point becomes the pivot for us to analyze the waterfall chart. What happens after the pivot point in time is our “closing credit” and what happens before is our “critical screen time”. Let me remind you that in this case, the pivot point is at 4 seconds and is based on hitting 90% in the filmstrip. Here is the chart:
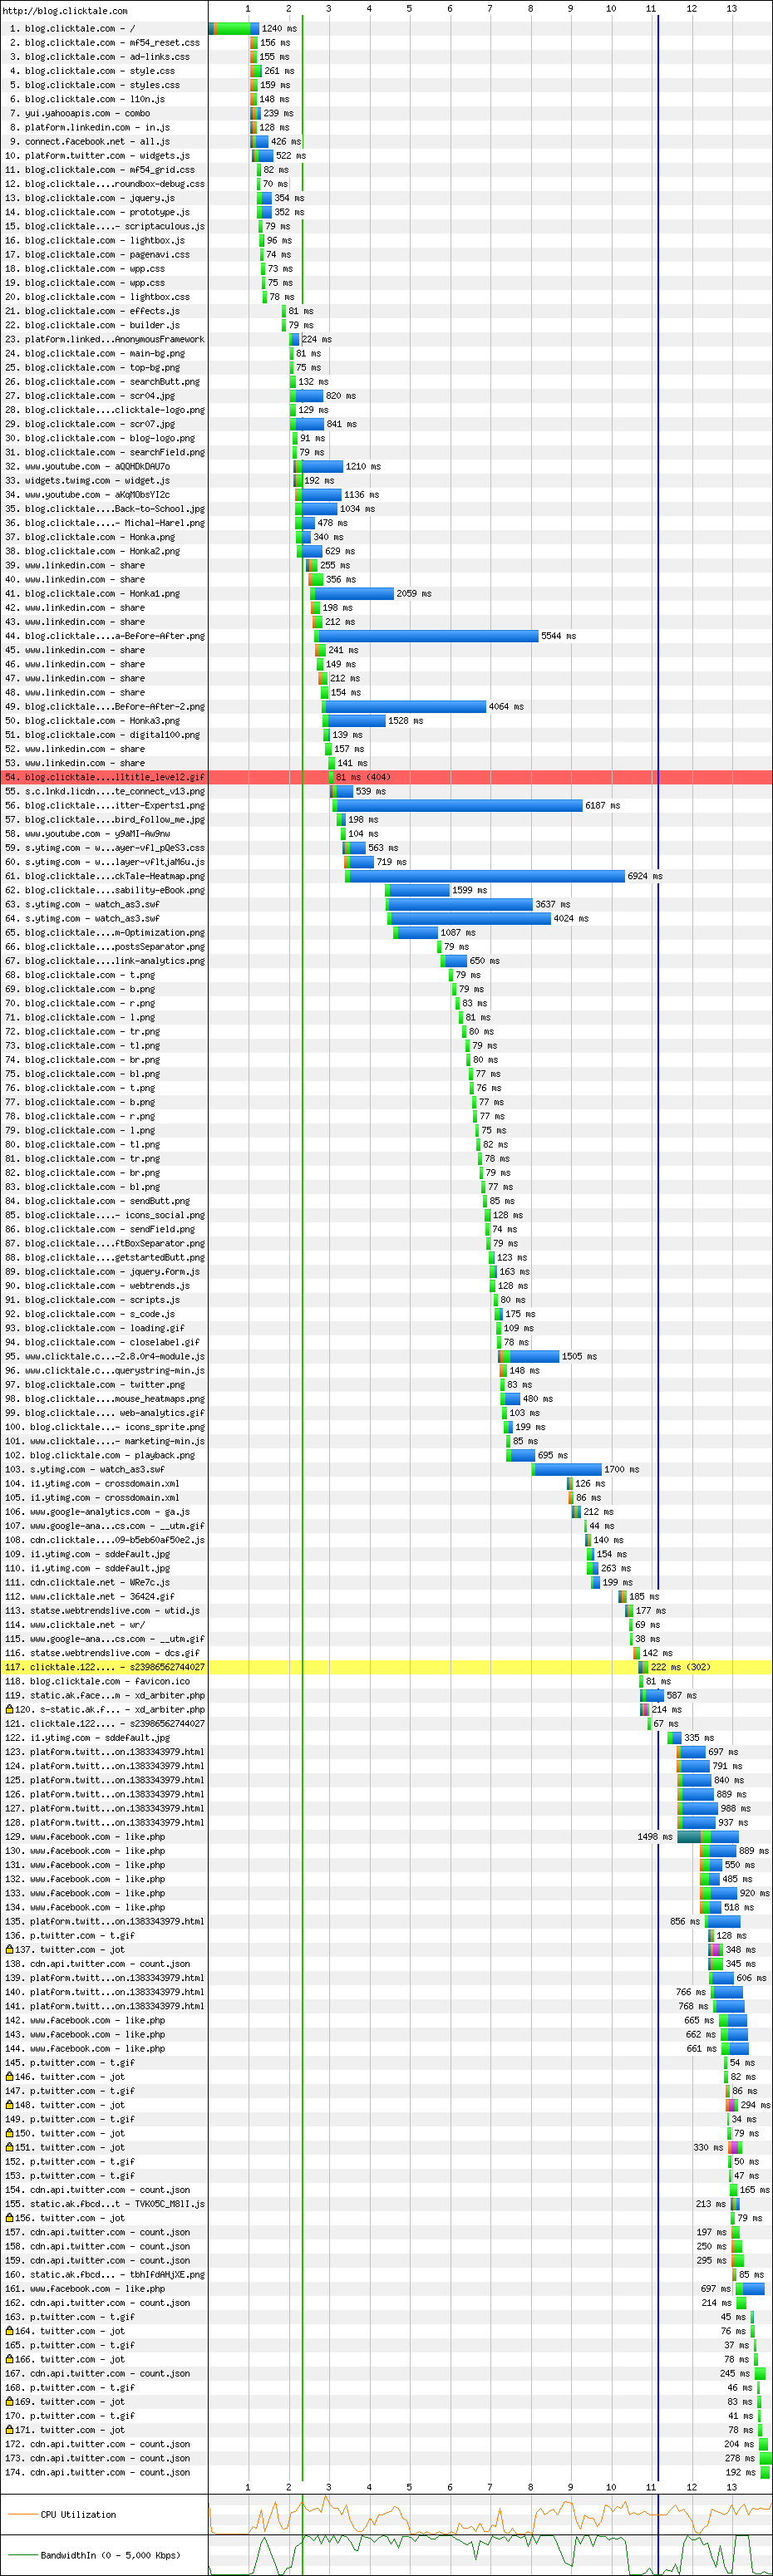
We see requests to blog.clicktale.com everywhere in the chart, as expected. Many optimizations are possible through improvements and re-architecture of the site itself. In this article we will focus on third-parties. Which third-parties are affecting our “critical screen time”?
- YUI (code libraries)
- LinkedIn (widget)
- Facebook (widget)
- Twitter (widget)
- YouTube (video in the blog)
Which third-parties are only featured in our “closing credits”?
- ClickTale
- Google Analytics
- WebTrends
- Adobe SiteCatalyst
It is worth noticing that the first category is mostly comprised of widget and UI components and the second category is comprised solely of analytics components. Furthermore, looking at the waterfall it can be seen that the requests from the analytics category precede Twitter and Facebook resources only and don’t delay any blog resources.
Analyzing and optimizing third-parties
Now it is the time to evaluate the critical components to see if they can be optimized. The best way to remove the effect of a third-party is by moving it to load at a point that is not critical. This isn’t possible for all types of third-party components. Components that are visual are by definition determining the pivot point and thus hard to move out of the critical zone. After all, if your widgets haven’t loaded, your page is not fully loaded, right?
Still some things can be done:
- Reduce the amount of third-party widgets and other elements that affect page rendering
- Make sure that all third-party components are loaded from fast HTTP resources, such as CDNs – you can ask the provider, research it online or see the timing of the specific resource in the waterfall
- Check if you can host components yourself as it can be faster to load data over an already established connection vs a new one that the browser will establish for the third-party
- Check if there is an asynchronous version of the component, such a version will load later in the pageview life cycle
- Test performance with and without certain components to understand their effect on loading
- Look for resources that are specifically slow in the waterfall and see if they can be optimized or moved to the “closing credits”
Conclusion
Hopefully after reading this article you are comfortable measuring a page’s load process using WebPagetest.org and then analyzing the results with the “filmstrip view” and “waterfall chart” reports.
I hope I was able to show that there are different types of third-party components and how you can check the effect of each component on your page’s load process.
I have shown you, using the the case study above, that third-party components that generate content for your site are the ones to watch for if trying to optimize user experience.