Recently I have had to monitor the operation of a system of pumps over a period of a few days. Monitoring in person would be a waste of time and would be a pain to do at night. The operation state of the pumps can be determined by the vibration of the system. When the pumps are not working, there is no significant vibration. Different pumps make different levels of vibration so it is possible to distinguish between them. I decided to make a device to collect such readings and store them locally for later analysis.
Lately have I been very busy with client work and don’t have much time for personal projects, hence low frequency of new posts in the blog, but in this case I thought that I could do something very quickly. I ended up building this entirely from parts that I already had in the lab and that I would have not probably used otherwise. So this is made of really simple (even legacy) components.
You could implement this in other ways and with other parts of course. Specifically, if you are looking to monitor something continuously and for a long period, rather than just for a few days, it will be preferred to build or buy a device that is “connected”. Such a device (let’s call it IoT) can collect and upload the data to a server in the cloud for processing. This article is not about that though. 😉
tl;dr an Arduino Uno board, with a matching Data Logger Shield (that has an SD card and a real-time clock) is connected to a ADXL345 accelerometer. The acceleration is sampled and the change in acceleration is summed to form a representation of the vibration level. Challenges included limited RAM on the Uno and I2C pull-ups. Code for the project is on github and the electronic build details are below.
Introduction
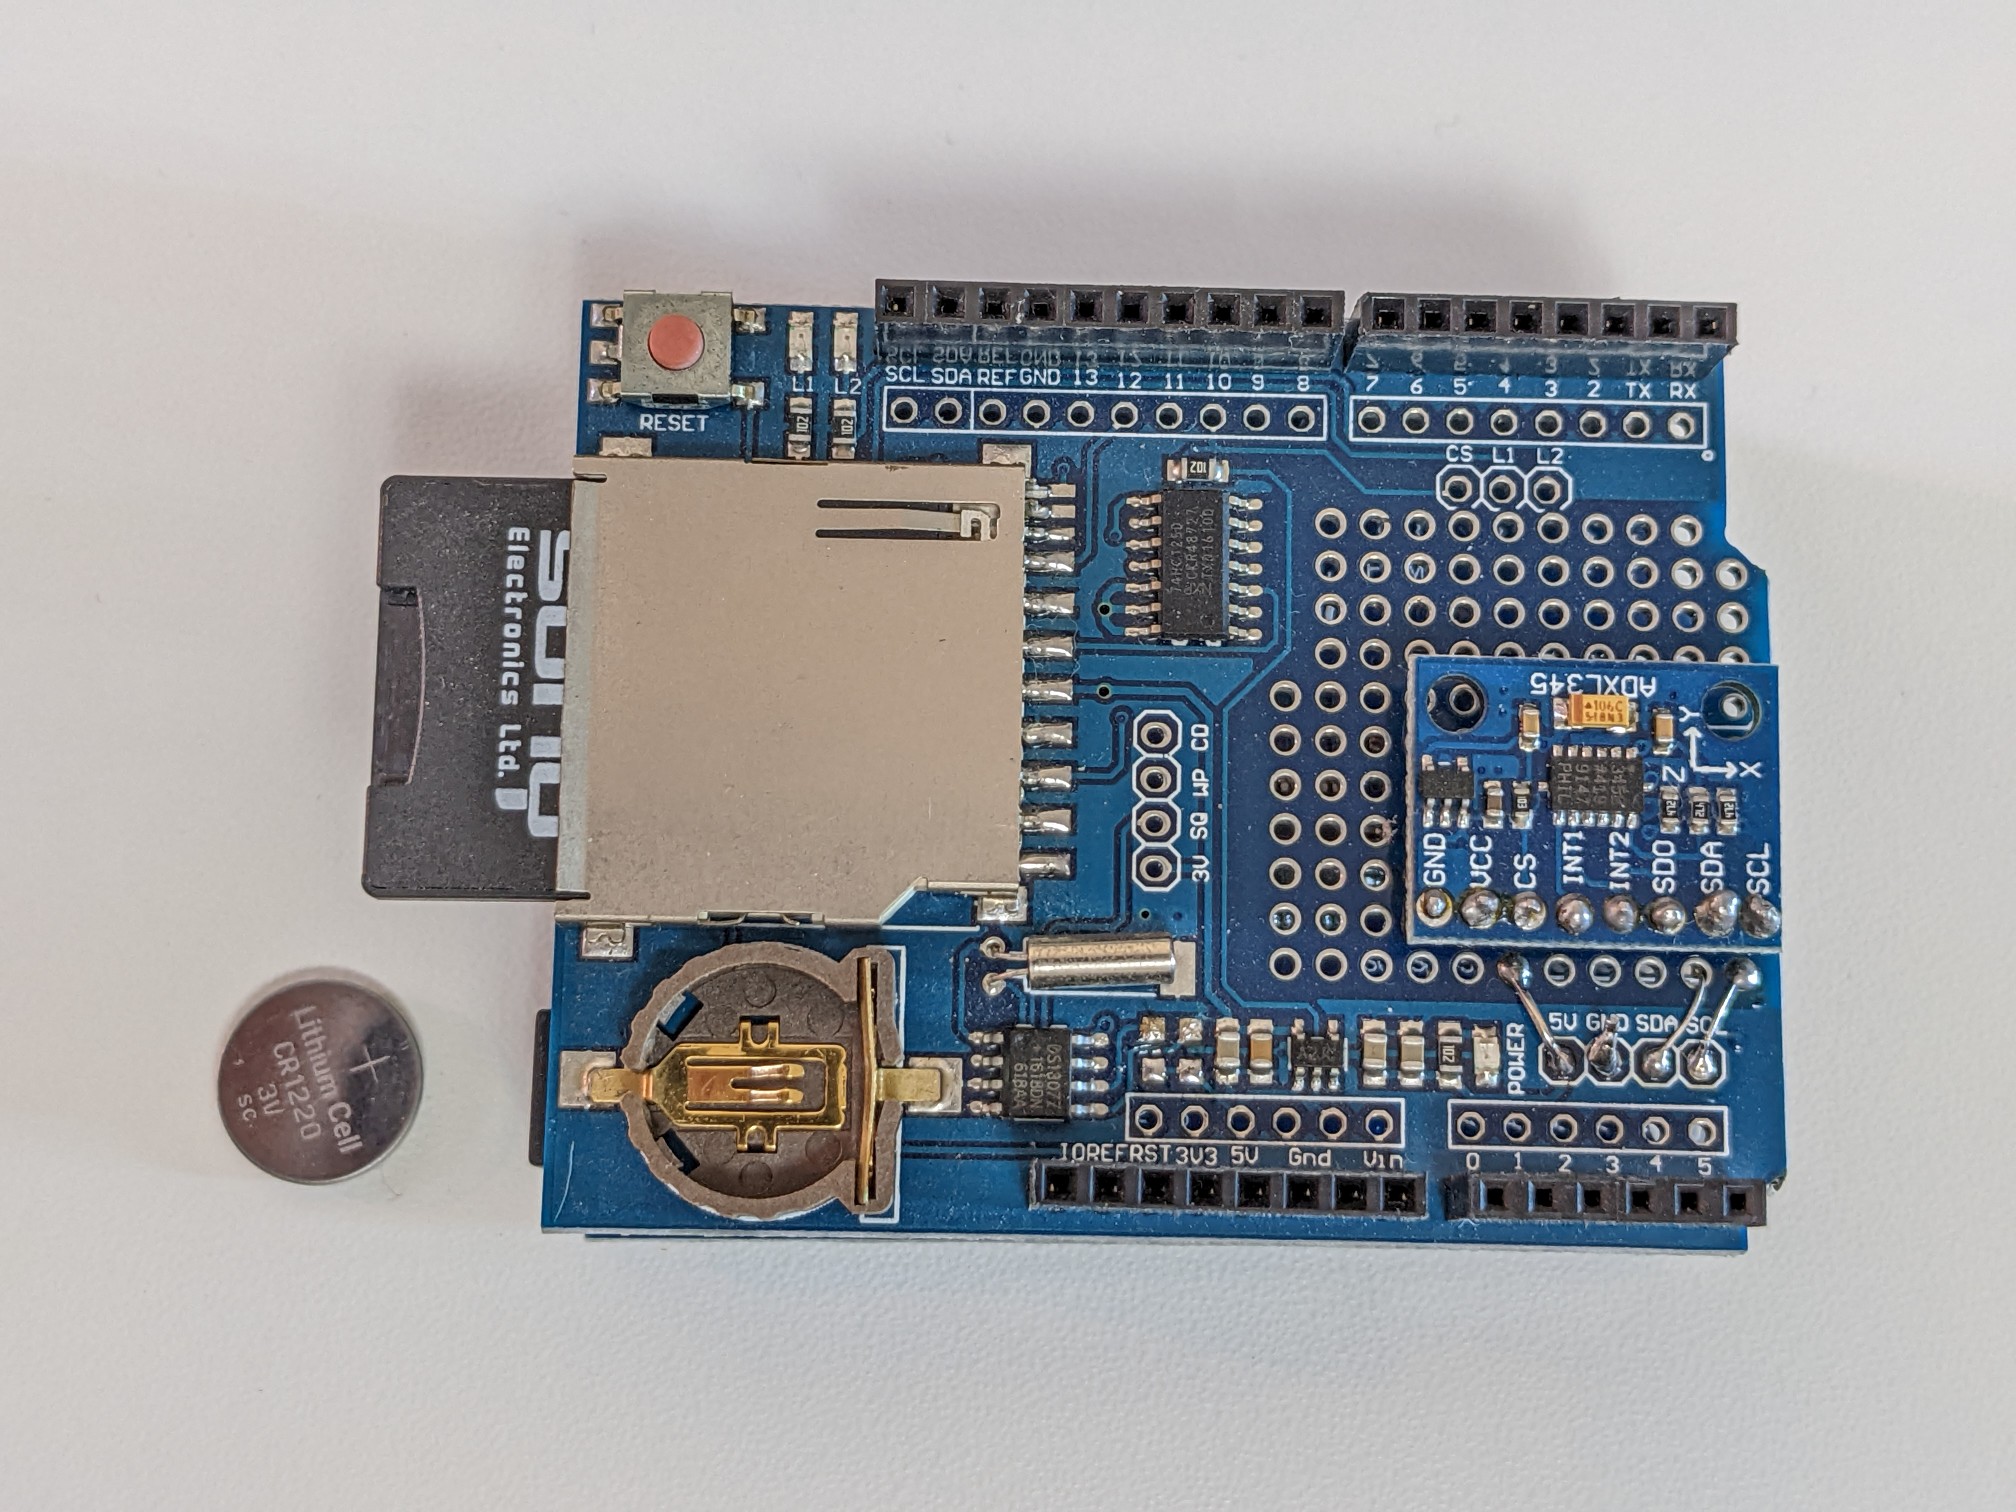
When building a logger, we are concerned with 3 major functionalities; data acquisition, storage and time stamps. Data acquisition is the process of reading data from the sensors and processing them into some values that we are interested in. Storage is just some place where we can store the result. The storage should be enough to hold our measurements for the period we are interested in monitoring. Time stamps is the ability to know the date and time for each measurement. To minimize work I chose an Arduino Uno Data Logger Shield (I had v1.0). That solved the storage and time stamp parts for me right away. For data acquisition I had an ADXL345 accelerometer module and I decided to use it. In terms of assembly, that left me with just needing to solder the accelerometer module to the shield.
Data acquisition
Connecting the ADXL345
The ADXL345 is a 3.3V device and is capable of I2C or SPI communication. I chose I2C. However, to complicate things, the module I had, had an onboard regulator from 5V to 3.3V and was expecting 5V as VCC. The SDA/SCL pins, however, were 3.3V logic and had pull-up registers to 3.3V. As a reminder, the Arduino Uno is a 5V board, which is normally not an issue for I2C as the data lines are pulled up to 3.3V, but the data logger shield had its own 5V I2C pull-ups for the sake of the RTC IC. To keep everything at proper voltages I de-soldered the pull-up resistors on the shield (located right next to the RTC chip). This left the I2C bus with 3.3V pull-ups and 2 peripherals, the ADXL345 accelerometer and the DS1307 real-time clock.
The pins on the ADXL345 module are connected as follows:
- GND – to GND
- VCC – to 5V
- CS – NC. There is a pull up on the module. HIGH = I2C mode.
- INT1/2 – NC
- SDO – GND
- SDA – SDA/A4
- SCL – SCL/A5
Processing sensor data
First I used the SparkFun ADXL345 library to interface with the device. There are no particular configuration settings except for “range of sensing”, which I chose low at 2G, since we are dealing with vibrations and want high sensitivity.
To calculate a measure of vibration (vibration level) a set of 10+1 consecutive acceleration measurements is taken. The number of measurements was chosen heuristically. The absolute difference between the measurement on each axis is summed to represent the vibration level.
Storage
The Data Logger Shield has all the electronics and mechanics needed to connect an SD card. SD cards come in a variety of sizes. The Arduino libraries that are available for SD cards are typically for SD cards that are formatted with the FAT file system. Different sizes of cards work best with different types of FAT file systems.
With regards to sizing, I aimed for 1 sample per second. Each sample is comprised of a date, time and vibration level in a CSV textual format. Hence each line is up to 15 bytes so we are at around 1.3MB of data per day, quite a low number. I ended up using a very small SD card of 128MB for this task.
At first I tried to use the default Arduino SD library but it became an issue very quickly as I was running out of RAM and having issues, which I assume are due to the (basic) FAT type on the 128MB card. To address that I switched to the SdFat library, which provided much better performance all around.
Real-time clock
The Data Logger Shield has all the electronics and mechanics for managing time and date. The shield has a DS1307 (which is a popular real-time clock IC), a low frequency crystal and a battery holder. The initial time and date are set at flashing time. Then if a battery is installed in the battery holder, the DS1307 will keep track of the time regardless of whether the board is supplied with power. The integration is done using Adafruit’s RTClib library.
Results
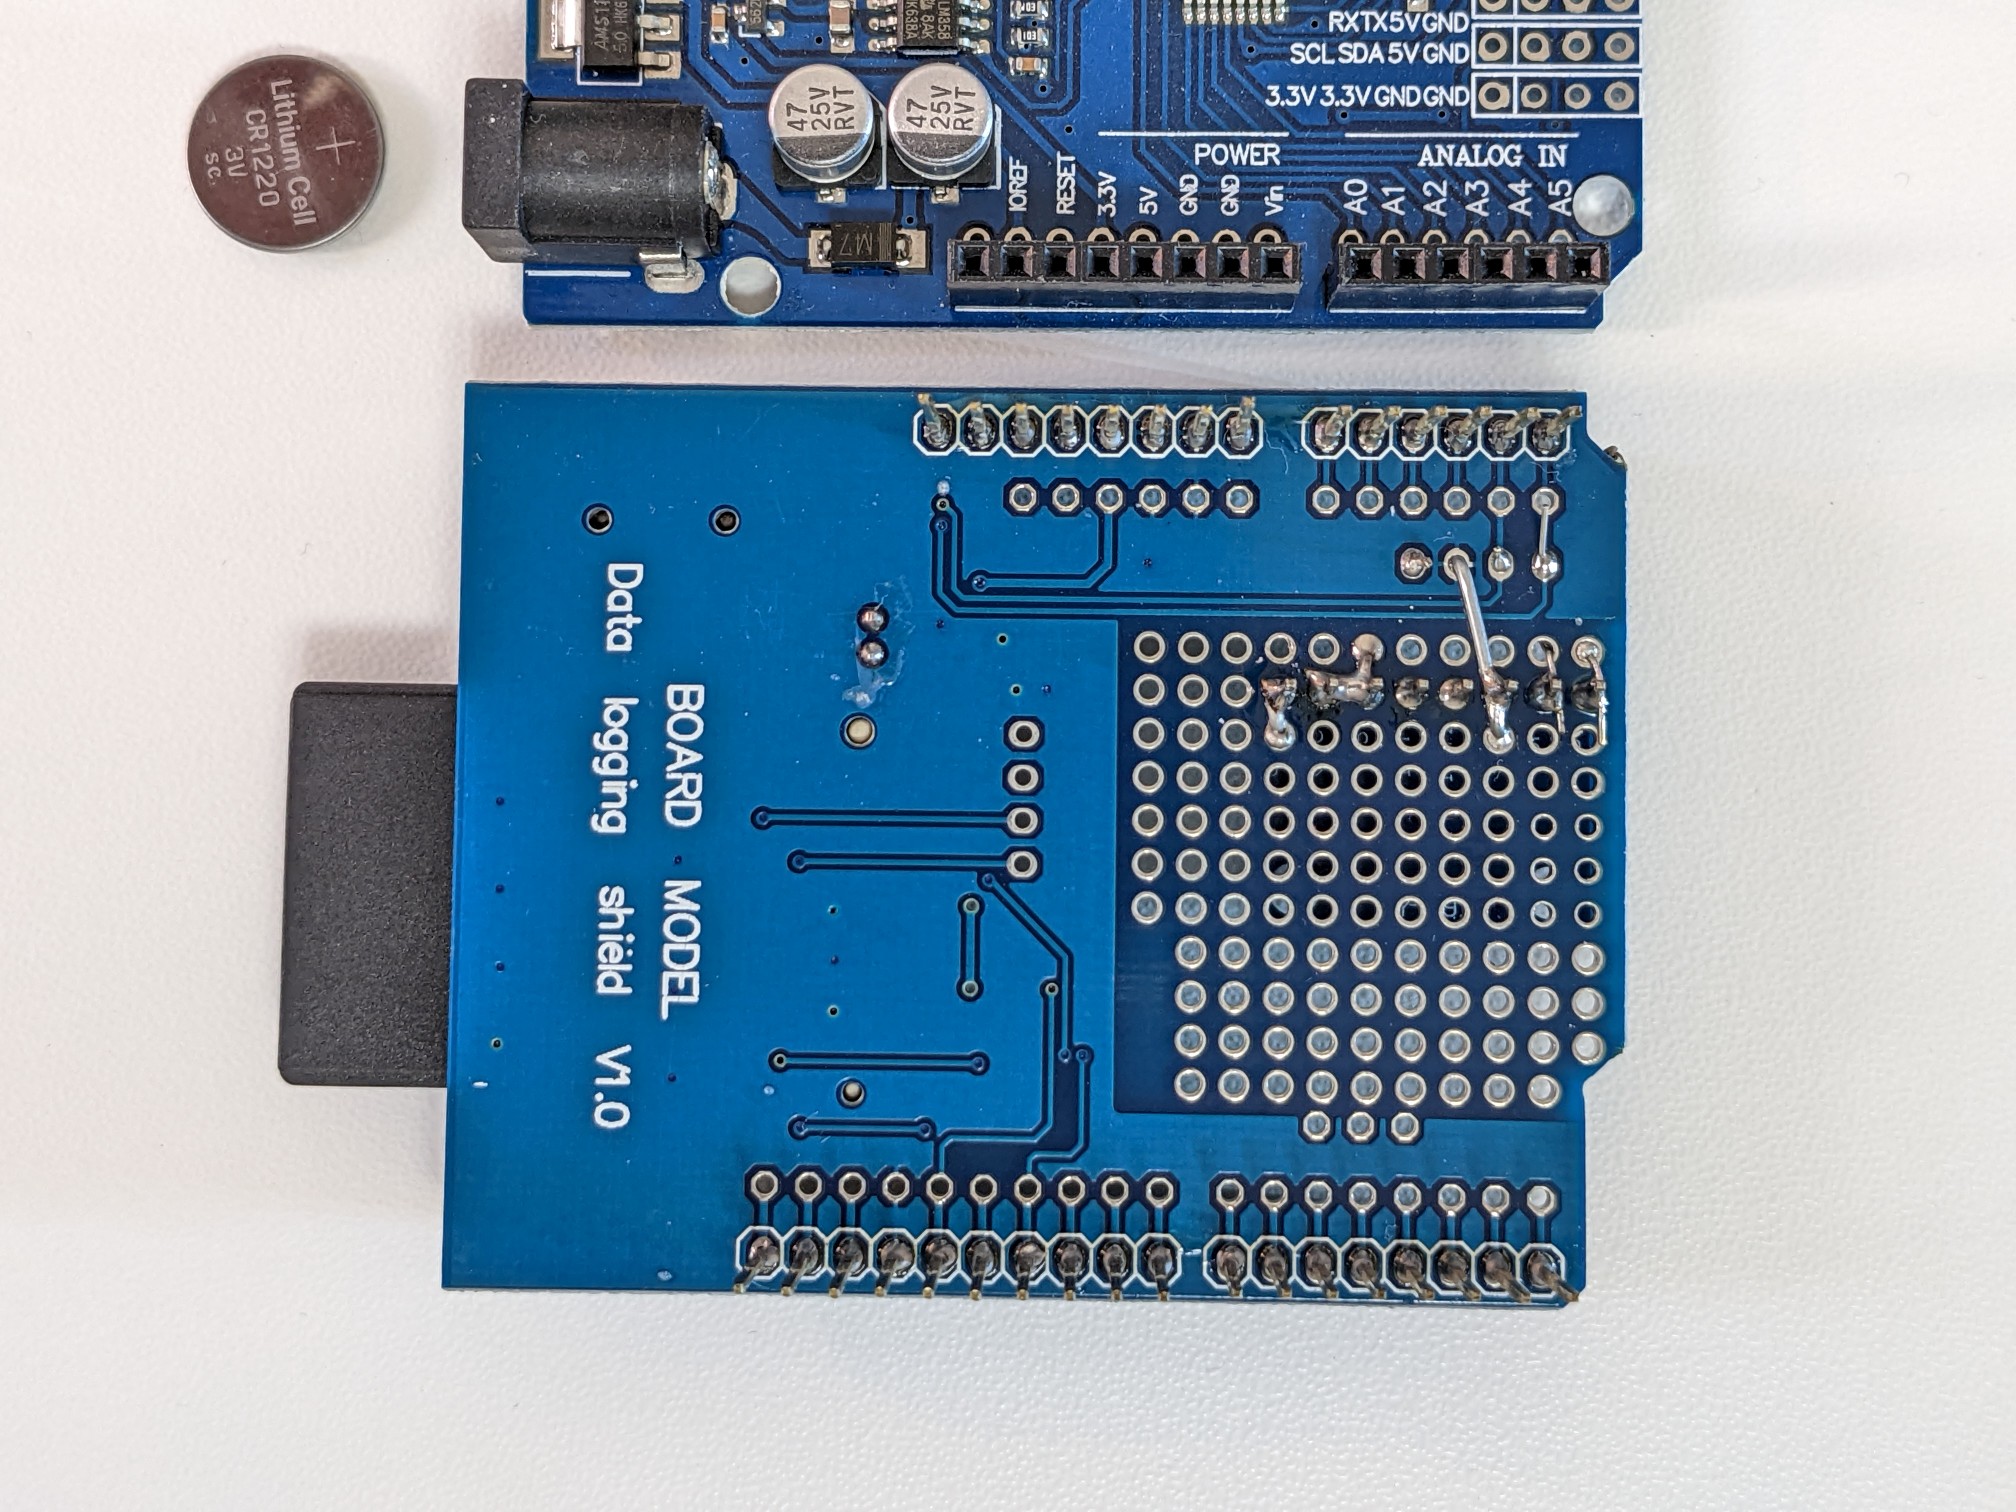
Hardware
The final device is simple, mostly based on off-the-shelf components and doesn’t require a lot of soldering.
Software
The software is also not complicated at just few hundred lines of code. The code is available in my github account. As most of my embedded projects, it is packaged for the Platform.io development environment but can be adapted for vanilla Arduino is needed.
Data
Once enough data has been collected, we can copy files from the SD card to a computer and load the CSV in a spreadsheet editor or some custom script. Here is a snippet of data that I collected:
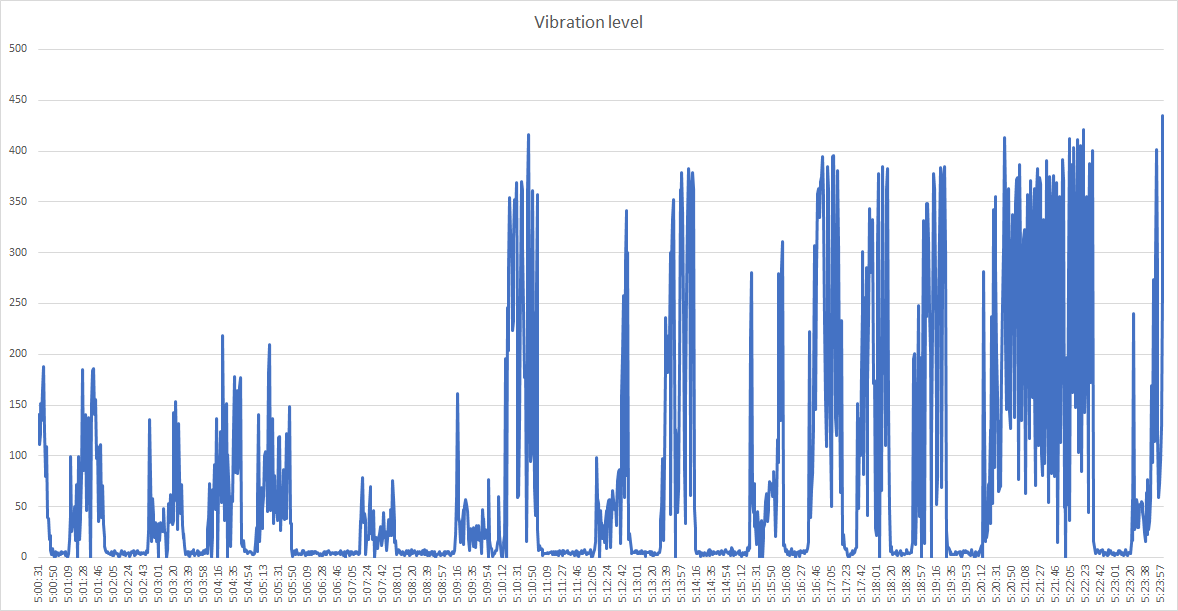
You can see intervals when the pumps were working and when they were idle. Pump A goes up to about 100-150 “vibration level” while it’s working, whereas pump B goes to 250-400. For example at “5:10:12” we replaced the active pump. It might be hard to understand the value of such information, but when you are trying to tune a controller of a pumping system, knowing whether the effective timings are correct is critical data for the technician.
Summary
This is my build of an Arduino Vibration Logger. Hope it inspires you to make your own version. Let me know if you have improvements or suggestions.
Hi Yarik, interesting approach to this. I am doing something similar, just focusing on the software, and am looking for budget hardware options to connect it to. You can check out the software and the current hardware options at https://industrialvibes.com/.
Most industrial vibration measurement applications use IEPE sensors, which the A/D converter has to power with a constant current, typically 2 mA, which can require the supply of up to 30V. They are a bit unusual in that it only requires two pins – the power and signal are on the same lines.
So I am after hardware that can measure at least two IEPE channels synchronously, preferably more, with sample rates from 1 to 50 kHz. Also with a USB connection to a windows PC and drivers available in matlab. If anyone can supply the hardware and is looking for someone to write the software to go with it, I would be keen to work with them and hopefully drive up sales of both.
I am also interested in alternative sensor options for vibration or anything else that make sense with my software. Anything where frequency spectra are a useful analysis tool and there is a need to figure out what is going on with non-stationary signals or measure for long periods of time. I will probably move on to strain gauges (wheatstone bridge sensors) next.
Hello Yarik,
Thank you for uploading this project, I have followed the instructions and built my own.
I have one question, what are the units of the values we are getting from the vibration?
Kind regards
Hi Sean,
Generally speaking, the values are the difference in acceleration in m/s^2 but there is a coefficient implicitly hidden in there. This project was not meant to measure an absolute value of acceleration or vibration but rather a relative value.
You can get close to a “standard” m/s^2 by following these steps:
In this project, the ADXL345 is configured for +-2g range and at that range it works at 10bit resolution. This means that the value of 2g (=9.806 m/s^2) is the digital value 512 as returned by the ADXL345.
Each result that the program calculates is a summary over VIBRATION_SAMPLES number of differences.
So if x is the measurement, then x/VIBRATION_SAMPLES/512*2g should roughly give you the average acceleration difference in g over the sample period.
It is not exact because how the individual axes are just summed for simplicity rather than by doing a vector distance operation. Obviously if you need an accurate measurement you can improve on those calculations or calculate different derivative metrics such as median, max, etc.
Hello Arik,
Thank you for your reply and further explanation.
Sean