Recently I have been doing some projects with the Arduino electronics platform. One of the projects involved benchmarking certain motors and required me to measure noise levels. I will cover that project in more detail in one of the future articles, but now I would like to write about the process and best practices of measuring sound levels and analyzing frequencies with an Arduino. I will talk about sound, microphones, sampling, FFT and more. This article is going to be targeted towards beginners, who are neither signal processing experts not electronics experts and it will be fairly high-level with links for more thorough reading.
Sound theory
Sound is a wave that moves in space and when it is stored (in digital or analog form) it is represented by a Waveform, which is the amplitude of the wave measured at each point in time at a certain point in space. You can think of this as sound passing through a microphone where it is being measured constantly and the measurements form the waveform. Because we can only measure a finite number of times per time unit, this process of measuring is called sampling and it generates a discrete signal. Furthermore, each sample in time is also made discrete during this process as computers and integrated circuits have finite accuracy and storage.
 [CC BY-SA 3.0 (http://creativecommons.org/licenses/by-sa/3.0)], via Wikimedia Commons")
Sampling of a waveform
Arduino capability for measuring signals and converting them to logic that the micro-controller (MCU) can process is provided by the Analog-to-Digital-Converter (ADC) that is pat of the MCU. Therefore, for an Arduino implementation, this process translates to connecting a measuring device (microphone for sound) to the MCU and sampling the value at the device by the ADC at a constant rate. The Arduino ADC senses voltage levels (typically in the range of 0-5V) and converts them to values in the range of 0 to 1024 (10 bit).
Depending on what we are measuring, sound levels may be very quiet or very loud. On one hand, a microphone on its own is usually not able to provide enough voltage for the Arduino to sense a change. The ADC needs a 5V/1024=4.8mV change to increase the digital value by 1, but a typical “electret microphone” might not provide this amount of voltage change for quiet sounds. For this reason a microphone is often used with an amplifier. On the other hand, a very loud noise and a high-gain amplifier can bring a signal to the max 5V, “over-exposing” or “clipping” it and again bringing us to a situation where the sampling is useless. Therefore it is important to match the device and the amplification level (gain) to each use-case scenario.
Microphone selection
When choosing a microphone for your Arduino you can get one of the available “microphone modules” that combine a microphone with an amplifier or some other logic on a tiny PCB. You can also make your own module, which has the added advantages of being able to control all the different aspects of the mic and amplification. I chose to get a module that is available of-the-shelf because it is easier and faster than making your own.
If your goal is to record sound and get a fixed sound level even in unpredictable situations you will want to get a module with automatic gain like this one based on MAX9814 from Adafruit. Such a module will “normalize” the sound to a set level. This will be the right solution for a scenario where you want to record voice for playback or to run a frequency analysis. Naturally, this isn’t the right choice for measuring sound volume. To measure sound volume and to be able to compare different measurements one to another you need to use a module where the gain is predictable. It doesn’t mean that the gain is fixed, it just means that the gain is configurable by you and does not change automatically.
I have evaluated 3 such modules. It is worth noting that a specific design might be on the market under different names as different manufactures make their own versions of the design with their own model numbers. Look at the board layout and note the main chip so you can identify the device.
MAX4466 based module
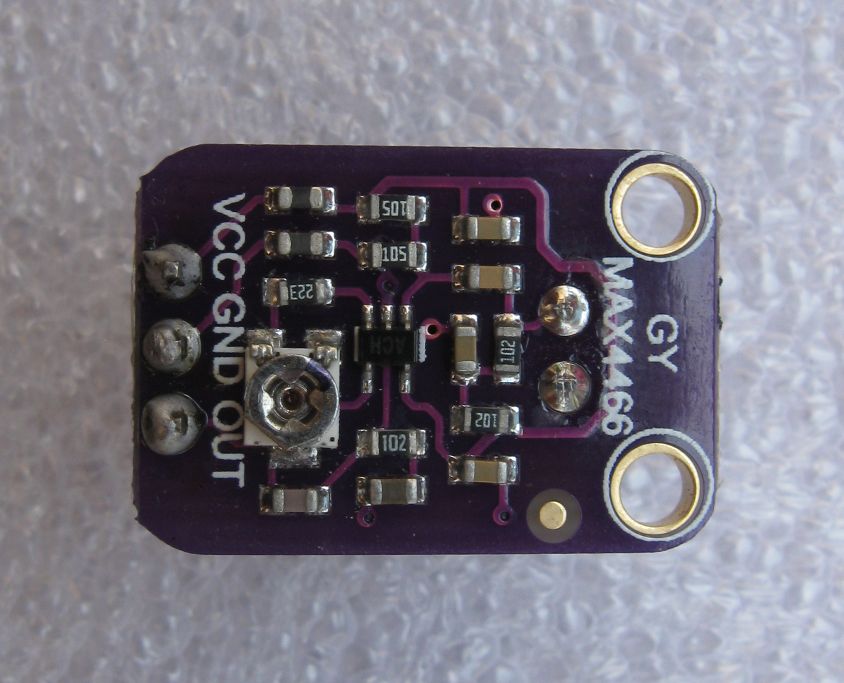
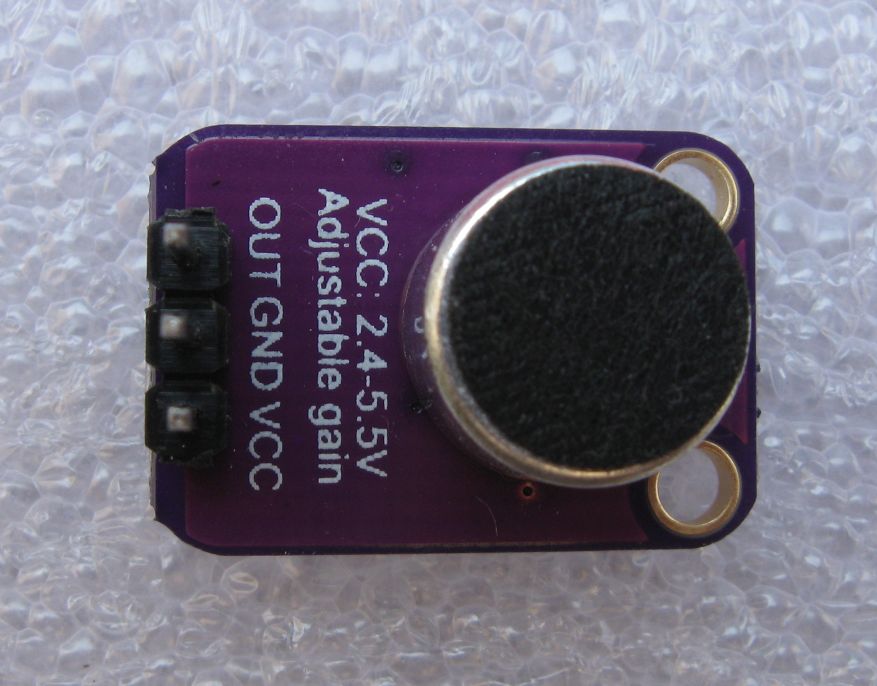
I got mine from the Far East but it looks like it is based on an Adafuit design. This module has an adjustable gain that you control with a tiny 1-turn potentiometer. There is a Vcc pin, a ground pin and an analog out pin. The analog pin emits a waveform where “0” is Vcc/2 and the amplitude depends on the gain and the volume of the sound. The MAX4466 chip is an op amp that is specifically optimized for use as a microphone amplifier, which makes this module a great performer and my eventual choice for the project.
“HXJ-17” / “Keyes” module based on an LM393
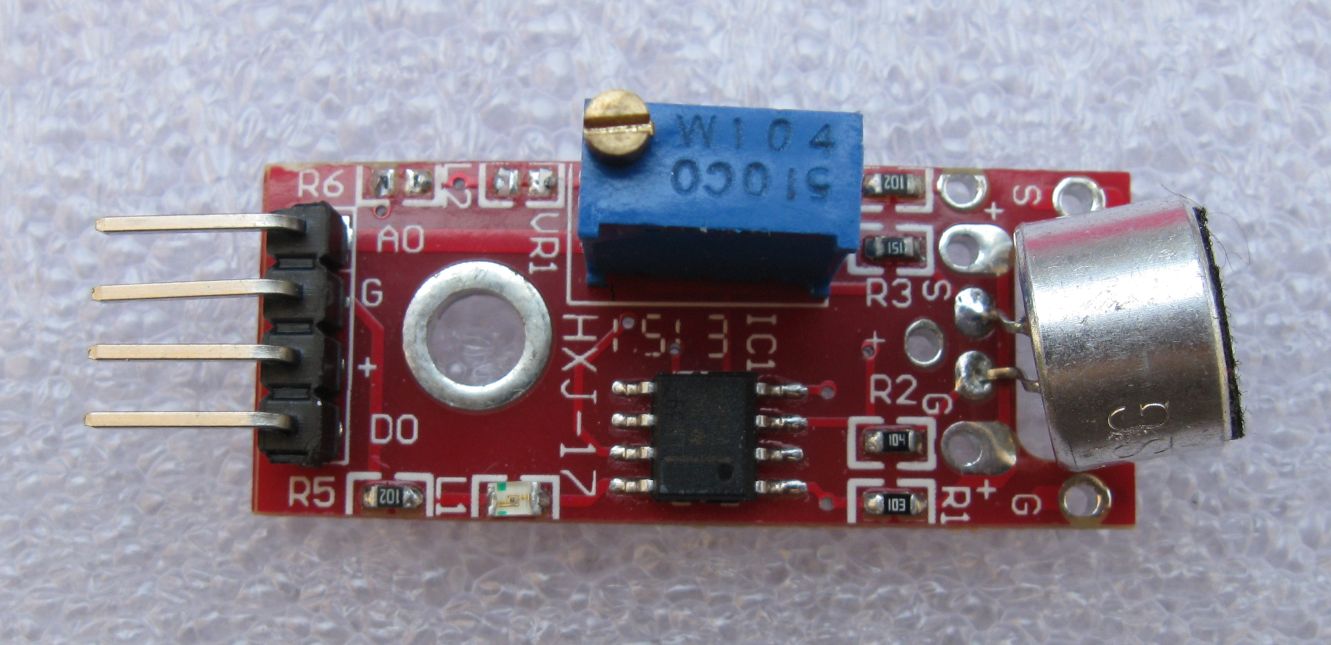
I got this module from a local electronics store. Not sure who designed it, but it has a multi-turn potentiometer, no amplifier and a LM393 comparator chip. There is a Vcc pin, a ground pin, an analog out pin and a digital out pin. Since this module lacks an amplifier, it is only good for sensing loud sounds, such as claps and knocks. The presence of the LM393 allows you to configure a threshold so the board can generate a digital output when the sound level is above the threshold. The only advantage that I can think of that this would have over implementing a threshold in code is that either 1) the comparator is more sensitive that the ADC of the MCU or 2) you don’t have an MCU in the first place and are wiring this board directly to a relay or a similar IC. Some sellers advertise this module as having an LM393 amplifier, but detailed analysis shows that it is not the case and that the analog out pin is not amplified.
“Sound detection” module based on an LM393
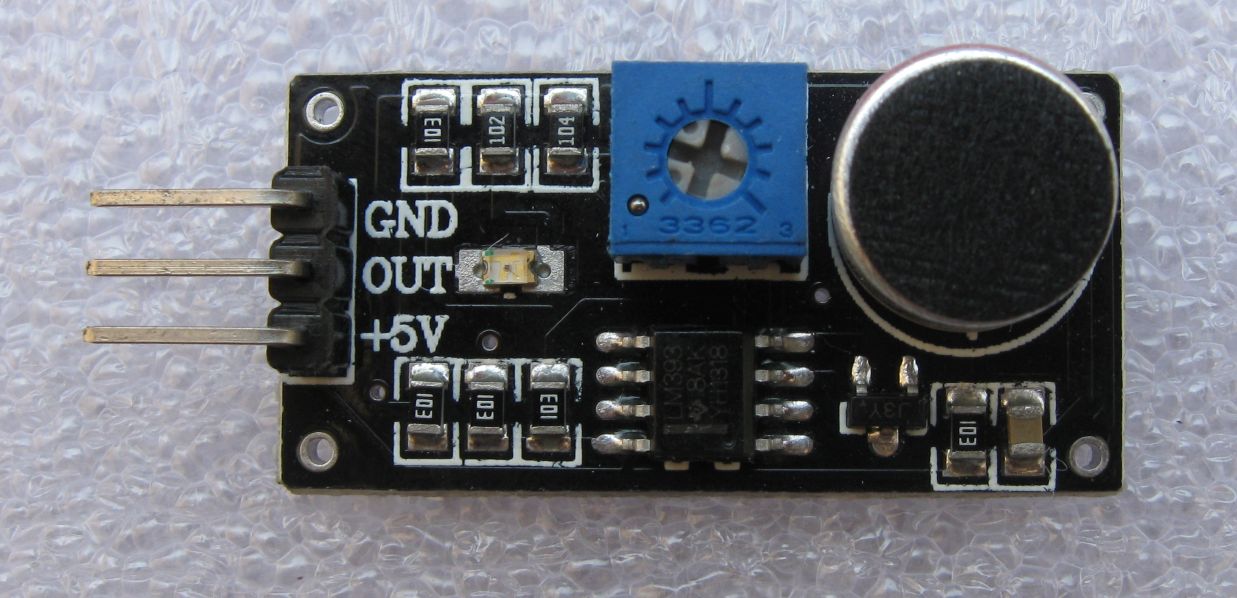
I got this one from the same local shop. This one is similar to the HXJ-17, but it is even simpler. It has a one turn potentiometer and no analog output. Leaving this useful for knowing if there is or isn’t a loud sound.
Analyzing analog input
As the first step, I would suggest you take some time to analyze the analog output of your module to see the baseline and amplitude. I have used the following Arduino function to gather data:
#define MicSamples (1024*2)
#define MicPin A0

// measure basic properties of the input signal
// determine if analog or digital, determine range and average.
void MeasureAnalog()
{
    long signalAvg = 0, signalMax = 0, signalMin = 1024, t0 = millis();
    for (int i = 0; i < MicSamples; i++)
    {
        int k = analogRead(MicPin);
        signalMin = min(signalMin, k);
        signalMax = max(signalMax, k);
        signalAvg += k;
    }
    signalAvg /= MicSamples;

    // print
    Serial.print("Time: " + String(millis() - t0));
    Serial.print(" Min: " + String(signalMin));
    Serial.print(" Max: " + String(signalMax));
    Serial.print(" Avg: " + String(signalAvg));
    Serial.print(" Span: " + String(signalMax - signalMin));
    Serial.print(", " + String(signalMax - signalAvg));
    Serial.print(", " + String(signalAvg - signalMin));
    Serial.println("");
}
You can then make some sounds at different volume levels and see how your average, min, max and span values respond. Looking at the result you might see that you need to adjust the gain potentiometer such that you utilize the max span for your sound levels while not overdoing it so not to clip your signal.
Implementing accurate sampling with 3.3V reference and free running
The analogRead function of Arduino makes it simple to get a digital value of an analog pin. It was implemented with single sample collection in mind. When sampling sound it is important to take our samples at a constant rate and to take each sample accurately. To achieve these two properties we will change a couple of things.
First, we will configure the ADC to use 3.3V as the analog reference voltage. The reason for this is that the 3.3V is usually more stable than the 5V. The 5V can fluctuate up and down especially when the Arduino is getting its power from the USB connection. The 3.3V is coming from a linear regulator on the Arduino board and can be connected to the ARef pin of the Arduino. This calibrates our ADC to map the 0 to 3.3V range of the analog input to the 0 to 1024 range of the digital values. For this to happen on the electronics level you need to feed your module with 3.3V and to connect the Arduino ARef pin to 3.3V. Make sure that your module is capable of operating at this voltage.
Use the following code to configure this mode:
analogReference(EXTERNAL); // 3.3V to AREF
Second, we will configure the ADC to work in “free-running” mode and read the sample values directly from internal registers, bypassing analogRead. As mentioned, analogRead is designed to read one value at a time and will perform initialization of the ADC for each read, something that we better eliminate. This will allow us to get a sampling rate that is more predictable.
Setup “free-running” mode with this code:
// register explanation: http://maxembedded.com/2011/06/the-adc-of-the-avr/
// 7 => switch to divider=128, default 9.6khz sampling
ADCSRA = 0xe0+7; // "ADC Enable", "ADC Start Conversion", "ADC Auto Trigger Enable" and divider.
ADMUX = 0x0; // Use adc0 (hardcoded, doesn't use MicPin). Use ARef pin for analog reference (same as analogReference(EXTERNAL)).
#ifndef Use3.3
ADMUX |= 0x40; // Use Vcc for analog reference.
#endif
DIDR0 = 0x01; // turn off the digital input for adc0
Read a batch of samples with this code:
for (int i = 0; i < MicSamples; i++)
{
    while (!(ADCSRA & /*0x10*/_BV(ADIF))); // wait for adc to be ready (ADIF)
    sbi(ADCSRA, ADIF); // restart adc
    byte m = ADCL; // fetch adc data
    byte j = ADCH;
    int k = ((int)j << 8) | m; // form into an int
    // work with k
}
Third, you can also adjust the speed of the ADC. By default the ADC is running at 1:128 of the MCU speed (mode #7). Each sample takes the ADC about 13 clock cycles to get processed. So by default we get 16Mhz/128/13=9846Hz sampling. If we want to sample at double the rate we can change the divider to be 64 instead.
Here is an example of how to set divider to 32 (mode #5) which equals a sampling rate of 16Mhz/32/13~=38Khz:
// macros
// http://yaab-arduino.blogspot.co.il/2015/02/fast-sampling-from-analog-input.html
#define cbi(sfr, bit) (_SFR_BYTE(sfr) &= ~_BV(bit))
#define sbi(sfr, bit) (_SFR_BYTE(sfr) |= _BV(bit))

// 1 0 1 = mode 5 = divider 32 = 38.4Khz
sbi(ADCSRA, ADPS2);
cbi(ADCSRA, ADPS1);
sbi(ADCSRA, ADPS0);
You can see all three of these code snippets implemented together in the source code of the project at github.
With this logic in place we can get decent waveform data for the Arduino to process.
Sound level measurement
Theory
The sound level is defined as the amplitude of the waveform and can be measured per set of samples which represent a part of a signal.

Peak Envelopes
For an ideal sine signal, the amplitude would be the max sample, but in practice it is easy for some samples to be outliers and to affect the max value significantly. For this reason it is more practical to use a metric that takes all the sample values into account. You can use an average, but it is more common to use Root Mean Square (RMS) which will give more “weight” to higher values.
The relationship between amplitude and RMS for sine waves is known and is amplitude= sqrt(2)*RMS. If we assume that a sound waveform is similar to a sine waveform we can use this relationship to estimate a stable amplitude based on an RMS value that we calculate.

Waveform with an RMS envelope
The values we are dealing with are relative and not absolute. After all we are using some value of gain to tune the volume levels to our digital 10bit range. It is very common to work with relative values when processing sound waveforms. The volume is then measured as a ratio from some other “reference point” value. A common unit used to express the ratio is decibel (dB). Resulting a formula:
dB=10*log10(v/v0)
Where dB is the level is dB units, v is the sample value and v0 is the reference value.
Since sound pressure is a field quantity a ratio of squares is used and the value “2” in the log becomes “20” [due to log(a^b)=b*log(a)] :
dB=20*log10(v/v0)
I was trying to achieve relative measurements, I chose v0 as the max possible amplitude (1024/2 for a 10bit ADC). This yields dB measurements which are specific to a certain gain and my device, but as long as the gain remains fixed, I can take several measurements and make valid comparisons between them. If you are looking to measure absolute sound levels you would need to calculate your level relative to a standard agreed sound pressure baseline value of 20 micropascals, which is the typical threshold of perception of an average human. Practically, this is typically done by attaching a special calibration device to the microphone. The device generates sound at a fixed dB level and you can adjust your calculations such that your dB measurement matches the dB value of the calibration device.
When using a reference value that is higher than your samples (max amplitude), your dB values would be negative and smaller as you approach the max.
When using a reference value that is lower than your samples (threshold of perception), your dB values would be positive and larger as you approach the max.
To make this even more complex, several factors affect measurement in practice. First, the human ear is not equally sensitive to all frequencies. It is typical to apply different weights to different frequency ranges. One such a unit of measurement is called dBA, but there are others with slightly different weights. Second, your microphone might not have equal sensitivity to all frequencies. Third, your speakers might not have equal ability to reproduce all frequencies at the same exact level. These complexities require very accurate and expensive equipment together with special calibration procedures to be able to measure sound levels correctly per standards. You need to understand that your ability to measure sound level with the setup described here is pretty rudimentary and suitable for rough relative measurements only.
Implementation
Let’s recap that our values are 0 to 1024 which stand for [-max,max] with 1024/2=512 being “0”. We will retrieve and process sample for some time, where the standard defines 1 second as “Slow” and 125ms as “Fast”. For each sample, we will measure the distance from the “0” to the sample value, which is the amplitude of that sample. Then we can do simple calculations for max, average and RMS. The values on our scale can be “normalized” to percentage of max amplitude or using dB or both. Here is a relevant code sample:
// consts
#define AmpMax (1024 / 2)
#define MicSamples (1024*2) // Three of these time-weightings have been internationally standardised, 'S' (1 s) originally called Slow, 'F' (125 ms) originally called Fast and 'I' (35 ms) originally called Impulse.

// modes
#define ADCFlow // read data from adc with free-run (not interupt). much better data, dc low. hardcoded for A0.

// calculate volume level of the signal and print to serial and LCD
void MeasureVolume()
{
    long soundVolAvg = 0, soundVolMax = 0, soundVolRMS = 0, t0 = millis();
    for (int i = 0; i < MicSamples; i++)
    {
#ifdef ADCFlow
        while (!(ADCSRA & /*0x10*/_BV(ADIF))); // wait for adc to be ready (ADIF)
        sbi(ADCSRA, ADIF); // restart adc
        byte m = ADCL; // fetch adc data
        byte j = ADCH;
        int k = ((int)j << 8) | m; // form into an int
#else
        int k = analogRead(MicPin);
#endif
        int amp = abs(k - AmpMax);
        amp <<= VolumeGainFactorBits;
        soundVolMax = max(soundVolMax, amp);
        soundVolAvg += amp;
        soundVolRMS += ((long)amp*amp);
    }
    soundVolAvg /= MicSamples;
    soundVolRMS /= MicSamples;
    float soundVolRMSflt = sqrt(soundVolRMS);
    float dB = 20.0*log10(soundVolRMSflt/AmpMax);

    // convert from 0 to 100
    soundVolAvg = 100 * soundVolAvg / AmpMax;
    soundVolMax = 100 * soundVolMax / AmpMax;
    soundVolRMSflt = 100 * soundVolRMSflt / AmpMax;
    soundVolRMS = 10 * soundVolRMSflt / 7; // RMS to estimate peak (RMS is 0.7 of the peak in sin)

    // print
    Serial.print("Time: " + String(millis() - t0));
    Serial.print(" Amp: Max: " + String(soundVolMax));
    Serial.print("% Avg: " + String(soundVolAvg));
    Serial.print("% RMS: " + String(soundVolRMS));
    Serial.println("% dB: " + String(dB,3));
}
So now with proper module and calibration you can measure sound level of different events or devices and compare them one to the other.
Frequency analysis with FHT
What if you want to “break” the sound into individual frequencies and measure or visualize each individual frequency? Can this be done with Arduino? The answer is that it can be done relatively easily thanks to some existing libraries. To turn signals from a time domain to a frequency domain you would generally use a Fourier transform. Such transforms are used for signals of different types, sound, images, radio transmissions, etc. Each signal type has its own properties and the transform that best suits a sound signal is the Discrete Hartley Transform (DHT). DHT will work with discrete, real values which form our waveform. To implement DHT we will use Fast Hartley Transform (FHT) and specifically the ArduinoFHT library.
The Arduino FHT library works with vectors of 16 to 256 samples. This size is denoted as N. In this project I will be using N=256 to achieve maximum resolution, but you may use smaller values if you are short on memory or processing power.
First, the algorithm takes N real numbers and results in N/2 complex numbers. Then we can pass the data to another function to calculate the magnitude of the complex numbers to get N/2 bins. In the end we get N/2 bins, each covering a frequency range of sampling_rate/N Hz. The highest value of the last bin will be sampling_rate/2 . The reasons for this relate to signal processing theory, specifically aliasing and Nyquist law. In practice, if you want to avoid any strange effects, such as higher frequencies “folding” over lower frequencies, you will need to make sure to use a sampling rate that is twice the highest frequency you expect to have in the sound signal. Otherwise you are not sampling fast enough. You should also not over sample, as it will result in low ADC accuracy and wasting of FHT bins on ranges that don’t appear in the signal. I found the value of 20Khz to be a good upper frequency based on the range of my microphone and on the range of typical human hearing. As a result the, sampling at 38.4Khz (divider=32) seemed optimal.
So for N=256 and sampling_rate=38.4Khz we get 128 150hz bins with the first been holding the magnitude value of 0-150hz and the last bin holding the magnitude value of 19050-19200hz. We can now focus on specific bins that interest us, send the values of all the bins over serial connection, store the values, display them in some way, etc.
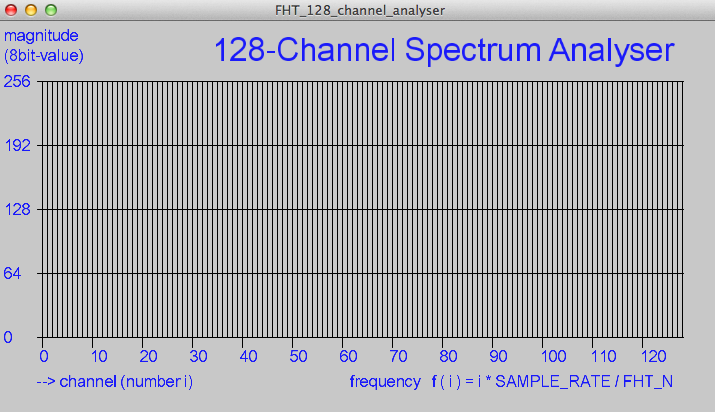
One of the fun ways to use the data, especially when troubleshooting and developing is to visualize with an analyser. Load the following FHT example code to the Arduino or adapt it to your needs. It gets the samples, runs FHT on the data and sends it in binary form over serial. Your Arduino should be connected to a computer running Processing development environment. In Processing, load the “FHT 128 channel analyser” project. I had to make a change to the project to make it compatible with Processing 3.0 . To do so, move the call to “size” function from within the “setup” function to a new function called “settings”.
Analyzer
Another way to analyze the data is for the Arduino to send it over serial in textual form, let it run for some time, then copy it from the serial monitor and paste it in a spreadsheet. For example using a code that is similar to this:
void MeasureFHT()
{
    long t0 = micros();
    for (int i = 0; i < FHT_N; i++) { // save 256 samples
        while (!(ADCSRA & /*0x10*/_BV(ADIF))); // wait for adc to be ready (ADIF)
        sbi(ADCSRA, ADIF); // restart adc
        byte m = ADCL; // fetch adc data
        byte j = ADCH;
        int k = ((int)j << 8) | m; // form into an int
        k -= 0x0200; // form into a signed int
        k <<= 6; // form into a 16b signed int
        fht_input[i] = k; // put real data into bins
    }
    long dt = micros() - t0;
    fht_window(); // window the data for better frequency response
    fht_reorder(); // reorder the data before doing the fht
    fht_run(); // process the data in the fht
    fht_mag_log();

    // print as text
    for (int i = 0; i < FHT_N / 2; i++)
    {
        Serial.print(FreqOutData[i]);
        Serial.print(',');
    }
    long sample_rate = FHT_N * 1000000l / dt;
    Serial.print(dt);
    Serial.print(',');
    Serial.println(sample_rate);
}
Then you can format the data in a spreadsheet, such as Excel, as a “3-D Surface” mesh graph. For example, see a graph of a Frequency Sweep from 1hz to 5000hz as captured and analyzed by the Arduino and FHT:
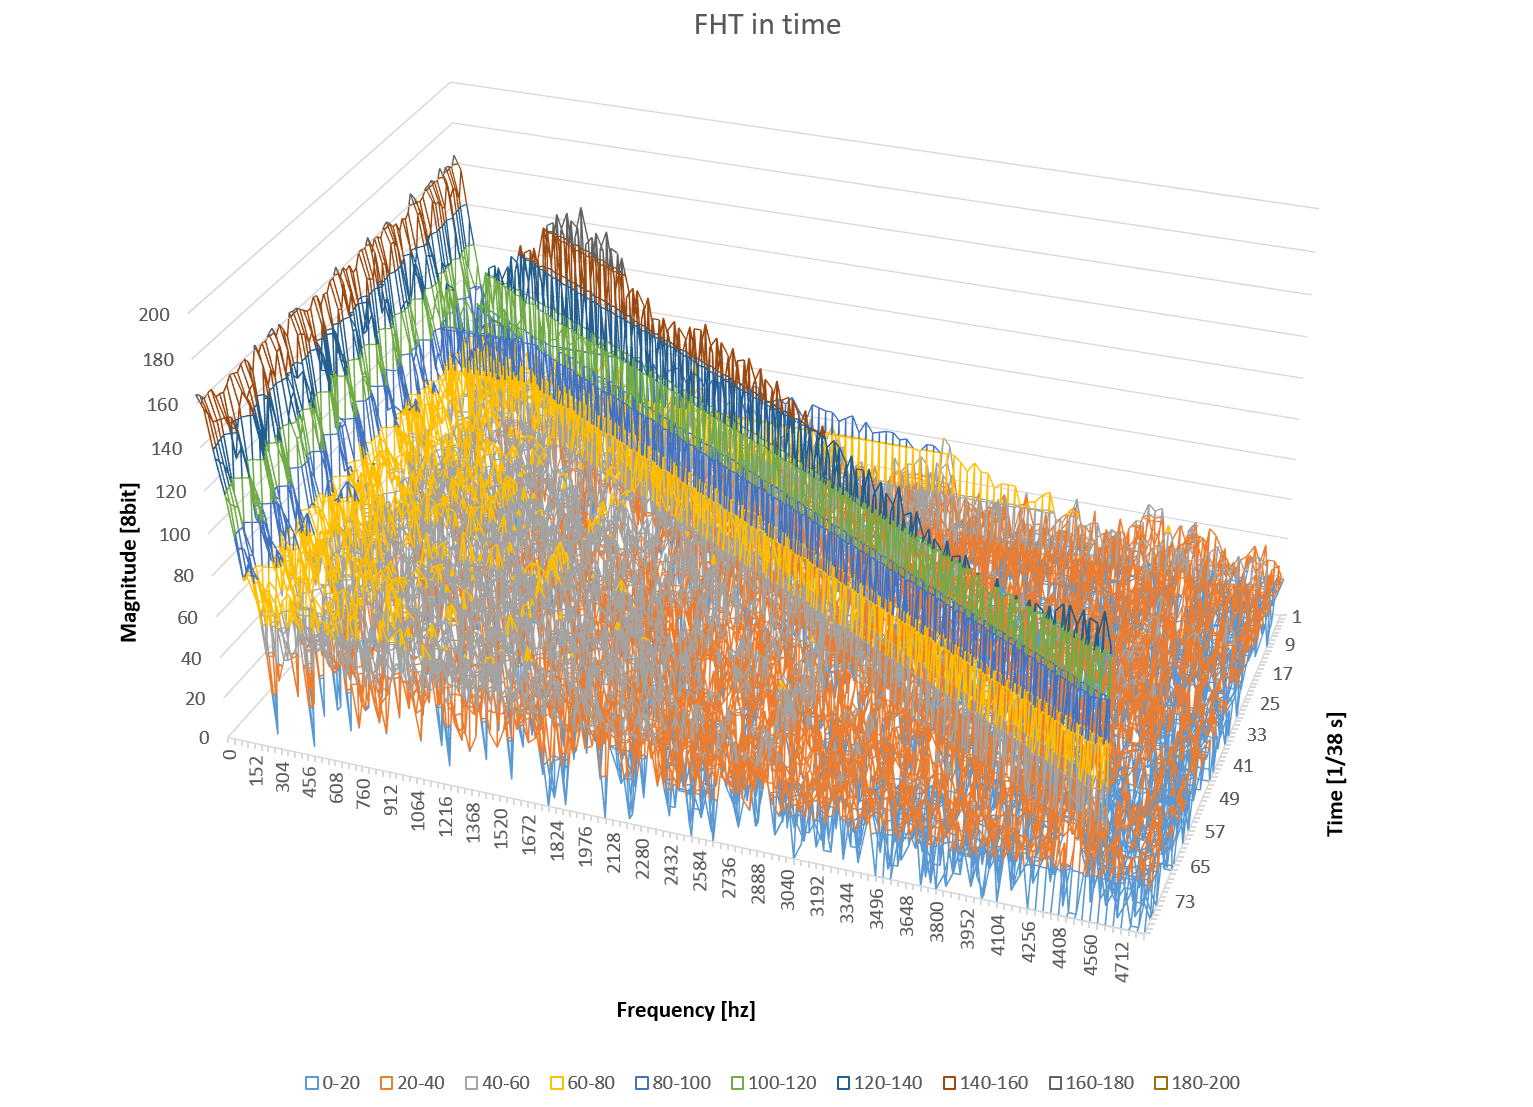
Mesh of FHT frequency sweep
Summary
My code for this project can be found at github for you to experiment with.
The Arduino can be used for relative sound level measurement and for frequency analysis/visualization. One just needs a microphone to match the use case, an Arduino, some coding and optionally the FHT library. Have fun and let me know in the comments if you make something nice using such a setup.
Hello,
Did I need the FHT library for the MeasureVolume?
I don’t run.
Greets
Finn
Hi Finn,
You don’t need FHT for the MeasureVolume part. What didn’t run? Do note that the code snippet in the article is just a snippet, and not a full Arduino program. See https://github.com/ayavilevich/ArduinoSoundLevelMeter for the full code.
Hi Arik! What a piece of nice project you had done. Yea I m really impressed because I love all code for sound processing. I really want reproduce it on my workbench and put some neopixel and oled screen to work together. But first of all I’m Teensy3 user go away from Arduino centuries ago. FHTnot really is compatible with Teensy and ARM. I tried finding FHT adaptation for Teensy but without success and I found that sound processing with Teensy Audio library is much better easier and efficient than any other stuff like that. But in my mind still blinking think about adaptation FHT to Teensy. Maybe you know where I can start digging for that? By the way I will try putting pieces of your functions to teensy FFT. At first glance looking pretty easy to do. I let you know if I get results. Cheers!!
Hi Diodac,
Glad to hear you liked the article.
See comments by Ricardo below. He worked on doing something similar with ARM and posted his results.
Hi Diodac,
I am thinking about a similar project.
I have a BluePill = STM32 development board, and would like to utilize the extra “horse power” of this board vs. Arduino Uno.
I was not able to find a FHT library for the STM32.
How did you solve it? Any success?
Maybe I missed something in my first read of this lovely blog post, or else it’s a little cryptic.
But I’m wondering what would make the best module for measuring sound pressure levels (between some 50-60 dB to +100 dB) for music played (at I believe 432Hz) through a speaker? Also, if it’s possible I would like to be able to make the PBC and solder it myself, even if it has to be a much larger scale.
Actually nevermind the 432Hz frequency, I seem to have confused it with something else. I mean the range between 20Hz to 16K Hz which covers every instrument and vocal.
Hi Max, signal processing is a bit difficult to explain and understand. Happy to try and clarify.
With regards to the dB range, dBs are relative, so you will not be able to measure proper dB values unless you can calibrate your setup with some specially designed equipment. As the system is described above, it can only compare sound levels (tell how much sound A is higher or lower than sound B).
With regards to a good module to measure sound levels, you should first try a MAX 4466 based module with an adjustable gain. For your purpose avoid modules with no gain or modules with auto-gain.
With regards to the frequency range, to process signals up to 16Khz you will need to sample at least double than that, at 32Khz. See above on how to set your ADC divider to 32 (mode #5) and achieve sampling of about 38Khz.
In the end, if you are interested in frequency analysis, you could pass the sampled data to FHT and get 128 bins back. Each bin will be 148hz wide.
Just replying to thank you for your brief and yet very useful guide.
Nice to hear, you are welcome.
Pingback: HM-10 or CC41-A module? Automatic Arduino BLE module identification | Arik Yavilevich's blog
Pingback: Sound level / Geiger counter with sigfox network | Projects
Arik, thank you so much. A very concise and instructive note. Also thank you for explaining fht. Has significantly simplified a project for me. Jim
Thanks for this very helpfull article. But in the implementation of MeasureVolume() you
do abs(k-AmpMax) and you say, that you get the amplitude by this. But wouldn’t it be half the amplitude?
Hi, this is probably due to confusing terms. Let me try and clarify.
First, I think it depends on what kind of amplitude you are talking about. What I refer to as amplitude here is the distance referenced to zero, whose max is “Peak amplitude”. If you are thinking of the distance referenced to “Peak to peak amplitude” then it would be different. See https://en.wikipedia.org/wiki/Amplitude for more details.
Other than that, analogRead values are: 0 => minAmp, 512 => “0” and 1023 => maxAmp. “Shifting down” by 512 we get: -512 => minAmp, 0 => “0” and 511 => maxAmp and make the signal correctly biased relative to its zero reference.
Does it make sense now or am I missing something?
So what is this
amp <<= VolumeGainFactorBits;
This is (software) Gain and it is optional [ https://en.wikipedia.org/wiki/Gain_(electronics) ]. Used here to increase the values for signals that are too low even with “hardware” Gain at max.
Applied here as a bit shift operation, so gain can be 0, 2, 4, 8 or 2^n times.
Hello Arik,
Thank you very much for sharing this work. I am excited to try this out, but receive the compile error below. I suspect I need to outcomment or uncomment somewhere, but can’t figure it out. I appreciate any help! ERROR:
ArduinoSoundLevelMeter.ino: In function ‘void MeasureVolume()’:
ArduinoSoundLevelMeter.ino:175:39: error: call of overloaded ‘String(float&, int)’ is ambiguous
ArduinoSoundLevelMeter.ino:175:39: note: candidates are:
In file included from /usr/share/arduino/hardware/arduino/cores/arduino/Print.h:26:0,
from /usr/share/arduino/libraries/LiquidCrystal/LiquidCrystal.h:5,
from ArduinoSoundLevelMeter.ino:1:
/usr/share/arduino/hardware/arduino/cores/arduino/WString.h:70:11: note: String::String(long unsigned int, unsigned char)
explicit String(unsigned long, unsigned char base=10);
^
/usr/share/arduino/hardware/arduino/cores/arduino/WString.h:69:11: note: String::String(long int, unsigned char)
explicit String(long, unsigned char base=10);
^
/usr/share/arduino/hardware/arduino/cores/arduino/WString.h:68:11: note: String::String(unsigned int, unsigned char)
explicit String(unsigned int, unsigned char base=10);
^
/usr/share/arduino/hardware/arduino/cores/arduino/WString.h:67:11: note: String::String(int, unsigned char)
explicit String(int, unsigned char base=10);
^
/usr/share/arduino/hardware/arduino/cores/arduino/WString.h:66:11: note: String::String(unsigned char, unsigned char)
explicit String(unsigned char, unsigned char base=10);
Hi Matthew, glad you liked the article.
The error is because the compiler can’t find a constructor variant for class String that will accept a float value. It can find a bunch of other constructor variants but not this one. I assume the issue is because your Arduino version is too old. Try version 1.5 or latest. On this documentation page you can see that String::String is supposed to have a float variant. Let us know if you manage to resolve this issue.
Regards, Arik.
Hello Arik,
your article is very instructive and i am eager to test this sound detection. Do you see any possibility to get it from 2 or more mics simultaneously (with only one arduino uno)?
Regards,
Bb.
Hi Bb,
I believe you could connect several mics, one on each analog port of the arduino. However, you only have one ADC in an Arduino, so sampling N mics will reduce your individual sampling rate by N and require you to switch ports every sample (so might not be able to use free-running mode). You could work with lower sampling rate or you can increase ADC speed to compensate (loosing accuracy). I would say it depends on your requirements for sampling rate and sample resolution.
Another option is to add an external ADC chip to your circuit. For example see this MCP3008 (https://www.adafruit.com/products/856). This is a bit more difficult path.
thank you very much for this !! I’ll play around and see the accuracy I can acve then.
can you please tell me the source code of this project by using pic16f877a
Hi siva, sorry, not aware if something like that exists.
Hello Arik,
I have read with interest your explanations regarding the sound level measure.
First, I test with an LCD to read the values in dB on the first line and a bargraph on the second one.
For testing, I use a low frequency generator with a 2.5V offset and after I will do a microphone amplifier.
I’m a beginner in Arduino and a programming problem : I have a maximum reading of 60 dB when I have on input a 1000 Hz sinusoidal voltage of 4.5V peak-to-peak and 0 dB when this signal is Zero (but centered on 2.5V by the offset of the generator). From 0 to 4.5V p to p, the scale in dB is respected (6 dB for a doubled voltage).
I think that these 60 dB maximum correspond to the limitation of 1023 of the 10 bits analog input. But I would like to have a larger scale, eg 90 or 100 dB for a 4.5V input.
Ideally, it’s be interesting to have access to a variable that would then allow entering a calibration value.
Do you have an idea for this and I thank you in advance?
Regards,
Pierre
Hi Pierre,
First, please note that in this article the dB are negative with dB=0 standing for max volume and negative dB values standing for lower volumes. I guess you have made some changes to the code while experimenting so your mileage may vary depending on your reference value (v0).
With regards to your question, you are right. The resolution of the reading determines the max range of the resulting dB values. Arduino ADC is 12 bit so we have 512 values of range between min and max readings. dB(range)=20*log(512)=~54 which is what you can get with the setup described above.
You can add “gain” to scale the dB but your accuracy will not increase and your actual measuring range will remain the same. To add gain just scale the “amp” variable after calculating the absolute value. See “VolumeGainFactorBits” in the article for how it can be done.
If you would have been processing a 16bit sound signal you would have dB(range)=20*log(2^15)=~90, which is what you might be familiar with when doing sound processing on a PC. A gain of 2^(16-12) should take you to that range. That gain is the same as shifting the value by 4 bits.
Regards, Arik
Hi Arik,
Many thanks for this quick and clear reply.
I will experiment with these suggestions and I will come back to you if, I have other questions.
Thanks again and regards,
Pierre
I need only to find db of detecting sound waves. Can someone please guide me on that regarding program. Which part will I have to concentrate from the above program.
Dear readers, if this article was relevant to you, then you might also like to read the article “Saved by the Bel — Understanding Decibels” at http://hackaday.com/2017/03/07/saved-by-the-bel-understanding-decibels/
Arik Hello, Your project is very interesting. I’d appreciate if you could post some pictures on the circuit, perhaps with the practical scheme assembly and shield yourself used. In addition, you could add an example of the data processing carried out with excel?
Hi Ciro, happy that you found the project interesting. The circuit is too simple to create a schematic for it. Gnd goes to ground, 5V/Vcc/+ to Vcc, and Out goes to A0. With regards to excel, there was no use of it for data processing, just for visualization. The serial data was pasted in excel and a “3d mesh” graph was created. LMK where you are having difficulties and I will try to provide more information.
Update: the code in github is using an external analog reference. This provides more accurate sampling using a 3.3V source. To use with the code unchanged, connect as following: Gnd goes to ground, 3.3V on Arduino to Vcc/+ on the module, Out on the module to A0 on Arduino, 3.3V on the Arduino to Aref on the Arduino. You will need to connect two points in the circuit to the 3.3V header, so use a breadboard or some connector to do that. Whatever works for you.
Hi, which sensor did you end up using? I’m plannin on making a sound direction detector but I’ve read online that the KY-038/LM393 only works for loud sounds and doesn’t provide much sensitivity (low analog range). How does the MAX4466 one behave? Did you only have to conmect the mic to Analog Input or did ou use some other components aswell?
Hi toki, I have used the MAX4466 based sensor for sound level measurement. It is the only one out of those I tried that is an amplifier and not a mere level detector. You can connect the OUT of the module directly to an analog input pin. I didn’t use additional components, but you can add an amplifier if you need further analog gain or just for the experiment.
I have not tried using an additional amplifier. If you find a good resource on that topic, please share it here.
Hi Arik,
Thanks for your interesting article. Unfortunately, I cannot read any values with the provided functions. I changed the microphone and the Arduino, but still reading zeros. Any suggestions?
PS: I don’t get any uploading errors.
Cheers!
Faraz
Hi Faraz, please post your schematics and parts used. What functions did you use? Are you getting non-zero values with analogRead? Have you tried exposing the mic to loud sounds?
Hi Arik,
Thank you for the reply. I have the code running now, the microphone was damaged I guess. It’s working with a new microphone now.
I have MeasureAnalog() and MeasureVolume() working fine, however, MeasureFHT() does not work. Here is the screenshot of the serial monitor readings:
https://static1.squarespace.com/static/57eac67bf5e2316869418ea4/t/5914f13537c581044515ec8c/1494544694098/Screen+Shot+2017-05-11+at+4.11.23+PM.png
Any suggestions?
Thanks in advance!
Faraz
Hi Faraz, by default the MeasureFHT() function sends binary data over serial. That binary data is meant to be consumed by the visualizing analyzer that is written in “Processing”. If you want to see textual output of the serial data, comment out this line “#define FreqSerialBinary”.
Hi Arik,
I’m a newbie trying this out for myself. I have some Arduino scripting experience but have never used Processing.
I am trying to use the FHT_128_channel_analyser in Processing but I am getting the error “Please fix the size() line to continue”. The fix you describe is a bit low in detail, I do not know how to “move the call to ‘size’ function from within the “setup” function to a new function called ‘settings'”.
Can you advise? I have only a vague idea of how it would be done in Arduino script. If you could just post your function that should work for me.
Thanks
Can you advise?
Hi Arik,
Figured it out. Found a Processing that advised that Processing likes real numbers in the size window command. The FHT_128_channel_analyser.pde defines it as:
size(X_WINDOW, Y_WINDOW);
These are all defined in the first part of the script, so you just doa bit of basic maths:
X_WINDOW = X_MAX + 2*X_OFFSET
X_MAX = 129 x 6 = 774
= 774 + 2*X_OFFSET
X_OFFSET = 40)
= 774 + 80
X_WINDOW = 854
Y_WINDOW = Y_MAX+BOT_DIST+Y_OFFSET
Y_MAX = 256; BOT_DIST = 80; Y_OFFSET = 60;
Y_WINDOW = 256 + 80 + 60
Y_WINDOW = 396
My size command is now:
size(854, 396);
Works now!
Just so its clear for any other newbie out there, those definitions are all at the start of the script:
final int X_OFFSET = 40; // x-distance to left upper corner of window
final int Y_OFFSET = 60; // y-distance to left upper corner of window
final int BOT_DIST = 80; // distance to bottom line of window
final int X_MAX = (128+1)*X_DIST+1; // x-axis length
final int Y_MAX = 256; // y-axis length
final int X_WINDOW = X_MAX + 2*X_OFFSET; // window width
final int Y_WINDOW = Y_MAX+BOT_DIST+Y_OFFSET; // window height
final int X_ENUM = 10;
Hi Steve, it is awesome that you were able to find a workaround yourself. What I briefly mentioned in the article is another solution. Instead of just a “setup” function I am using:
void setup()
{
noStroke();
fontGraph = loadFont(“ArialUnicodeMS-48.vlw”);
textFont(fontGraph, 12);
println(Serial.list()); // show available COM-ports
//port = new Serial(this, “COM7”, 115200);
port = new Serial(this, “COM4”, 9600);
port.buffer(129); // 1 start-byte + 128 data-bytes
fontA = loadFont(“ArialUnicodeMS-48.vlw”);
textFont(fontA, 16);
}
void settings()
{
size(X_WINDOW, Y_WINDOW); // size of window
}
With the “size” function being called from a new function “settings” that is not there in the original example.
Mind that your setup function might have other parameter values, such as serial port, etc.
Ok thanks will have a go with that too!
Hi Arik,
I’m working on a noise level meter and therefor I’m most interested in frequencies below 8kHz. I tried to reduce the sampling rate to get a maximum of 8kHz within 8 (or 16) channels. I tried to change ADCSRA (division factor) to 0xE6, but this doesn’t change anything.
I did my tests with the example code from the FHT library.
I hope you got any idea.
Reinhard
I found the second definition of ADCSRA setting in the loop. I changed
ADCSRA = 0xf5; // restart adc
to
ADCSRA = 0xf6; // restart adc
Now it works.
Hi Reinhard, happy that you managed, but I am not sure I follow you.
The ADCSRA is initialized in “setup” to 0xe0+7 and then the divider is further adjusted to 32 in the “ADCReClock” block.
In the loop, only the ADIF bit is affected by executing “sbi(ADCSRA, ADIF); // restart adc”. The divider is not changed in the loop, instead the ADC process is restarted.
Please take a look at the documentation of the ADCSRA register, it is responsible for several independent functions of the ADC.
Hi Arik, you are right referencing to your code.
I was using the example code from the Arduino FHTLibrary where the divider is set again in the loop.
Thank you.
hi,
thanks for presenting your interesting work!
Similar to Max W. I would like to measure dBA levels from a PA-Soundsystem between ~80 – 110dB. There is no need for an absolute accuracy of the measurement. I use the MAX 4466 based module. There is a handheld dBA-Meter, I could use to compare the readings and calibrate the circuit.
With the help of your blog I was able to run it. Now it´s reading values from -6 to 0 dB. Unfortunately mathematics is not my specialist area 😀
Wouldn´t a slight variation of the code print out the desired dBA readings?
Hi Tobias,
You can use another meter to calibrate your build. Assuming you have a meter that is calibrated for a “standard agreed sound pressure baseline”, as described above, then the delta between the two measurements should be a constant value (in dB). Measure different sound levels and check the deltas. If the difference is not constant then you are probably hitting sounds that are outside of the supported range of either of the devices.
The constant is a function of a ratio between the standard reference and the specific reference of your build. The ratio is in the log and becomes a constant due to log rules (http://www.rapidtables.com/math/algebra/Ln.htm#product-rule) i.e. hard math.
For example, if your devices shows -10dB and the standard meter shows 30dB, then it means you can change your code to add 40dB to the value and that would calibrate your device to the standard reference. LMK how that works for you.
hi! Thanks, I measured the different sound levels. Now I try to understand the math to calculate the constant value. If I do not get any further, I´ll reply.
Hi Tobias, just to clarify. You measure the constant offset by making an experiment. You don’t calculate it. Once you measured the offset, you can use math to calculate how much “louder” your build’s reference point is from the “standard agreed sound pressure baseline”, but it is not required.
hi! yes, I understand so far. I used a buzzer as sound source and took the readings from the meter and the arduino, for three different distances.
Distance 50cm: Meter 100dBA / Arduino -4,9dB
Distance 10cm: Meter 110dBA / Arduino -1,1dB
Distance 2cm: Meter 120dBA / Arduino -0,25dB
I know, just to add the difference in dB to get the dBA, but it´s not that simple..
Hi Tobias, you are hitting the volume limit of your build. 0dB is the absolute max volume that your build can detect and you are too close to it. Move farther away, reduce gain or reduce buzzer volume. Please post data for 3 new distances such that Arduino measurement is below -5dB. Cheers.
hi! The poti on the MAX 4466 Module was in middle position. Even if I turn it completely down, the reading is not below -6dB in calm environment.
I didn´t change something on the gain factor bits in the original code.
Well, that is no good. 😉
AFAIR, dB for quiet room should be below -20dB.
By default there is no software gain, but double check that VolumeGainFactorBits is defined as 0.
Try to debug the code and the circuit. Using “MeasureAnalog” is useful to see the raw readings, which should be around 512.
hi! Independently of Arduino, I viewed the output signal of the MAX 4466 Module with an oszilloscope. There is a DC offset on the output of about +2,5V. Is this the way it should be?
Unfortunately I don´t get the “Analyzing analog input” sketch to work:
… cc3fuV8c.ltrans0.ltrans.o: In function `main’:
… arduino/main.cpp:43: undefined reference to `setup’
… arduino/main.cpp:46: undefined reference to `loop’
collect2.exe: error: ld returned 1 exit status
Hi, it is normal for the DC offset to be half of Vcc. So if you are seeing 2.5V then I assume you are powering the module with 5V. Is it possible that you are powering the module with 5V but are using the “#define Use3.3” option in the code? Please check compatibility. Note that by default the code is meant to be used with 3.3V analog reference, so you would need to power the module with 3.3V. If there is a mismatch, it would look like there is “signal” even when the room is quiet, as you are experiencing. The information for 3.3V and 5V operation is described above in the article and comments. Take another look.
hi! I read the article very carfully, but for some reason I´ve mistaken “module” with “arduino board”.. I wondered how to drive Arduino with 3,3V, so I powered all components with 5V, sorry 😀 Now it works fine, in quiet room 0% soundVolRMS and -54dB. It is very sensitive to the orientation of the buzzer as sound source. For reproducible results, I´ll mount the sound source, meter and module-mic on a rail.
Great news! Happy to see that it works well for you now.
It is interesting about the orientation of the buzzer. What about the orientation of the mic? It looks unidirectional unlike a typical sound meter.
hi!
I made new measurements with a mechanically more stable construction.
Silence: Meter 42,5dBA / Arduino -54,4dB
Distance 142cm: Meter 92dBA / Arduino -26dB
Distance 100cm: Meter 97dBA / Arduino -22dB
Distance 50cm: Meter 100dBA / Arduino -14dB
How to change the code to adjust the readings? 🙂
But I´m not satisfied with the quality of the buzzer, also the sound spread is unfavorable.
I´ll mount a small speaker and the Meter or Arduino in a fixed distance together. Then I drive the speaker with a frequency generator at some defined output voltages. That will give more reproducible results.
..sorry, correct is “Silence: Meter 42,5dBA / Arduino -54,1dB”
…ok, I recognize the scheme. I just have to add the difference of the arduino reading. With the wrong hardware wiring, it seemed to be more difficult to calculate, now its clear 😀 Just add around 114 – 119dB to the reading. I´ll try to make a better test setup.
Hey, yes, exactly. You can see it visually in this graph: http://imgur.com/a/pHH20
Mind that the delta for “silence” measurement is different. This can be for two reasons. A) noise sensitivity differences B) Weighting differences.
“A” means that your Arduino module is probably more sensitive to noise than the commercial sound level meter. So it will report a higher level in a silent room. That level is due to “noise” (inaccuracy in the circuit, not real noise).
“B” is due to differences in weighting the different frequencies. You wrote that your sound level meter is dBA, this means that it weights different frequencies differently (more info in the article above). The Arduino is in “simple” dB values, it is possible to implement dBA measurement in Arduino, but it won’t be trivial. If you know the frequency of your buzzer then you can look at the A-weighting function ( https://en.wikipedia.org/wiki/A-weighting#/media/File:Acoustic_weighting_curves_(1).svg ) and figure out the specific weight, maybe understand what is going on at a deeper level.
hi!
Thank you for your great support 🙂
I just started with Arduino, my specialty is electrical engineering, I´m into the technology of past days – such as the construction of tube amplifiers for audio playback. I find it hard with silicon-based electronics and informatics 😀 The Arduino board laid a long time unused in my workshop..
But I have to say this project brings me fun, I´m working and learning with it 🙂
Also thanks for your good project documentation.
Today, I tested it on the PA music system, which it is intended for. Basically, the dBA readings of the commercial meter and of the Arduino seem to fit together. But it also reacts quite differently with real music – instead of the buzzer as sound source.
– The heights have more effect on the meter, in contrast to Arduino, which is more sensible to bass frequencies. The readings differ partially significantly. One might allow a compromise.
– But there is still another problem:
The PA sound system is very loud, the meter reads peaks around 114-115dBA. Mic module seems not to clip. The arduino sketch produces -54 – 0dB; my correction factor is +100. The result is, it can just read 110dBA in the max.! But if I change the correction factor to around +110, the readings are simply wrong 🙁
– The reading of the commercial meter is slow, the measured / displayed values change around 0,5s. The printout of Arduino is fast, too fast for a good readoff a LCD. Is there a way to slow it down?
The meter reacts smooth, bass impulses from the sound system don´t produce great magnitudes – this is what I would also wish for Arduino. It shows great jumps in the serial reading and plotter when the music plays.
– Is it possible, to make an average reading over time, around 0,5s, like the commercial meter? Then the readings of meter and Arduino would be much more similar.
Some pics from the test today:
http://abload.de/image.php?img=arduinodbamessungkurztqotj.jpg
http://abload.de/image.php?img=arduinodbamessungkurzj3q5u.jpg
Some pics of the test with the buzzer, mounted on a rail for several fixed distances. A nice experiment, but not comparable with real music sounds.
http://abload.de/image.php?img=arduinodbakalibrierune8q0a.jpg
http://abload.de/image.php?img=arduinodbakalibrierunfhr2n.jpg
http://abload.de/image.php?img=arduinodbakalibrierunp2ptl.jpg
Hi Tobias,
Great to see you are enjoying your project. Thanks for posting the photos, nice build.
It is probable that the mic on the module is not as accurate as the commercial sound meter. It is quite a cheap mic/module. There could be non-linearity with volume or with frequency response.
Still, you can change the time-weighting for Arduino and try to make it the same as your commercial meter. Note that the sketch prints the interval time in ms on every pass. By default it is probably around 50ms.
Increase the define “MicSamples” to increase the time of each interval. I recall that “Slow” is defined as 1s, so you would define MicSamples as 38000 to get to about that.
Also, mind what frequency you used to calibrate. If you calibrate with basses, it might be wrong for higher frequencies. See A-weighting graph.
Hi Arik,
first i would like to thank you for this detailed paper. I would refer to a question that was already asked by Ciro, the circuit. Im using arduino uno and when you say “5V/Vcc/+ to Vcc” do you mean 3.3V on the arduino by the second “Vcc”. And can you please show the part of the circuit containing ARef.
Hi Davor, when I answered Ciro’s question, I described the wiring for the, trivial, 5V use of the module. If you are looking to do the more accurate 3.3V wiring then it is a bit different. I will update my answer to Ciro above. Thanks for pointing this out.
Hi Arik, I found formula
Prms=(Vrms/gain)/mic Sensitivity
dB = 20xlog(Prms/Pref)
I got problem, I do sampling data from 50ms and then I calculate Vrms form that data. But Vrms from sensor GYMax4466 is still higher than I expected.
Can you give me advise for sampling data from arduino uno?
Hi Rizqia,
Not sure what Prms is vs Vrms. You should provide context.
What happens if you use the code in this article?
I try to calculate SPL using that formula. And then I lil bit imitate your code
Here’s my code
void loop()
{
unsigned long t0, t; // Start of sample window
unsigned int sampleAvg;
unsigned int sampleRms;
t0 = millis();
for (int i=0; i<50; i++) {
sample = analogRead(0);
sample1 = abs(sample-512);
sampleAvg += sample1;
sampleRms += ((long)sample1*sample1);
}
t = millis() – t0;
sampleRms /= 50;
sampleAvg /= 50;
float dataRms = sqrt(sampleRms);
float vAvg = (sampleAvg * 3.3)/1024; // convert to volts
float vRms = (dataRms * 3.3)/1024; // convert to volts
float dBAvg = 20*log10(((vAvg/77.15)/0.0063)/0.00002);
float dB = 20*log10(((vRms/77.15)/0.0063)/0.00002);
Serial.print("Time: " + String(t));
Serial.print(" vRms: " + String(vRms));
Serial.print(" dB: " + String(dBAvg));
Serial.println(" dB: " + String(dB));
the problem is dB value is still the same (measure 69-72 dB) despite I take this sensor to noisy place (it should be more than 90 dB).
Can you notice what's wrong in my code?
Hi Rizqia,
Here are some comments that I have about the code.
You are making a calculation using 50 samples, not 50ms. Why is that? Seems to little IMO. What does “Time: ” print?
Not sure why you are converting to volts or where the various constants in your code are coming from. How did you decide on those values (Pref, sensitivity, gain, etc)? Please link to the formula you found.
Hi Arik,
Sorry to make you confuse, on first comment I tried to take samples data for 50ms, but then I changed the code to sampling 50 samples..
I print “time” to know how long it takes to get 50 samples..
I try to get SPL value (decibel unit) using this sensor. I got the formula from this jurnal http://www.sciencedirect.com/science/article/pii/S2468067216300293
– Pref: 20 micro Pascal (which is referenced to the lowest thresholds of human hearing)
– mic sensitivity: -44dB/Volts/Pascal (I got from mic datasheet) or it’s similar with 0.0063 Volts/Pascal
I need to convert the samples in RMS to Volts, so I can get the Value of SPL using that formula..
Hi Rizqia,
With the additional information it starts to make sense. I understand that: 0.0063 is the mic sensitivity [V/Pa], 0.00002 is the reference SPL level [Pa] and 77.15 is the gain.
How did you calculate the gain to be this specific value?
Based on your algorithm and constants I see no reason why you shouldn’t be getting 100dB results. Please change your algorithm to make 2000 samples (instead of 50) and then post your Serial.print* output from when you are measuring a noisy place.
Hi Arik,
The problem is solved. I changed the way to calculate the rms value. Thank for your articel, it helps.
For gain, I measured the pot and other resistors, then I calculate by my self using formula gain for non-inverting amp.
For samples, I did take 50, 500, and 1000 samples, and the results are still good.
It can measure from 60-104 dB at particular places. And I use apps decibel 10th from IOS to compare the value. It has span 4-6 dB. But that’s ok, since I didnt use the real SPL meter.
Hi Rizqia,
Glad to see you figured it out! Thanks for the interesting comments you provided.
Based on the Adafruit schematic of the MAX4466 module I see that the gain is (22K+PotValue)/1K .
For the benefit of the other readers, can you explain the change in the RMS calculation that you made? Was there a bug?
For accurate calibration you will have to use a calibrated reference device. A calculation based on spec values will not be enough, because each parameter has some error tolerance. For example the sensitivity of the mic is +-2dB.
With regards to the number of samples. If you only take 50 samples, you risk not capturing the entire wave length of lower frequencies. So at 50 samples and 40Khz sampling rate you might miss on frequencies below 800hz. Not sure if this is equally true for sounds of a single frequency as it is for natural sounds that are a mix of frequencies but still something to take in mind.
Hi, using your code cant get more than 80dB in the serial plotter even when my SPL metter shows 100dB. I tryed to adjust the gain but doesnt work. Can you post your how you calculate now the rms value? thanks
Hi Arik,
For gain, yes I found on adafruit schematic too.
For rms calculation, There was a bug. So I turned (long)sample1*sample1 into sq(sample1) to fix it.
I guess you’re right about sampling. Thanks for your feedback.
Hello Arik,
Thanks for the extremely useful guide!
I’ve been running trough some problems trying to imitate your setup.
When I try to calibrate my sensor using the code displayed at section “Analyzing analog input”, I get no difference in response whatsoever when I try to change the module gain. When connected to 3.3V in a quiet environment, the module outputs min and max close to 330, these values switch to min: 0 and max: 660 when I clap loudly. At 5V reference level, the min and max change to around 500~510.
Is this normal behavior? BTW, I’m using a MAX4466 based module.
Also running the final code, I get fixed rms: 140% and the db measure ranges between 0,0000~0,0010
Thanks!
Hi Guilherme,
Changing the gain will not affect the “base values” if there is no sound. For this module, the base is always module Vcc/2 . The values of 500~510 match Vcc/2 for Vcc=5V.
Values of 330 match Vcc/3 for Vcc=5V which is 3.3V/2. I believe you are powering the module with 3.3V but using an 5V analog reference.
Follow the article to switch to 3.3V analog reference and try again. Change gain while there is sound and see if your analog reading range changes in sync. Good luck.
Searched all the articles about spectrums and found the most useful one here
Thanks a lot!
But i am having some trouble with “free running”
I was doing good with analogRead but when changed it to “free running”, the “k” i got seemed to always be 1023
(the micro i used is HXJ-17)
What pin do you use on Arduino for the mic and what pin on the HXJ-17 do you connect to Arduino for the analog data?
Please include a clear photo of your setup.
What values were you getting with analogRead before “free running” mode?
Hi Arik!
the setup is just that HXJ-17’s “A0″is connected to Arduino UNO’s “A0″
the values i got from”analogRead” are between 0 and 1024, which i think is right.
But know i doubt that there is something wrong about my setup, cuz i can’t understand some explanation you put.I’m working on them now.
Mick
Hi Arik!
Thanks for your useful article!
I’ve got all the data correctly.But I am wondering why the value i get from FreqOutData[] is up to 200, even in silence?Aren’t the spectrums supposed to be show nothing when it is silent?
Thanks again!
Paul
Hi,
Have you managed to overcome the “free running” issue? For the benefit of the other readers, please let us know how to fix that.
FreqOutData should not go that high for silence. See my “FHT in time” 3D graph above for an example. If it is going that high for you then you are not doing something right. Check your fht_input values to see if the issue is with FHT or earlier.
Hi Arik,
Absolutely first class! Really enjoyed it, to the point where I am now waiting to get all the components to replicate your project. I have a question. If you wanted to measure that the “pitch” of the noise that you are monitoring has changed (it went from lower to higher frequencies), what modifications/additions to your code would you make?
Many thanks,
Branko
Hi Branko,
How do you define the “pitch of the noise”?
Didn’t do something like this myself, but maybe other readers can contribute.
Hi Arik,
Thanks for coming back so quickly. I used a very non-technical term. What I really meant is that the spectrum changes towards higher frequencies, possibly even into the ultrasonic range. If anyone has any ideas on how to measure this, I would welcome the thoughts. Thanks.
Branko
Hello Arik,
Thanks for your helpful info really. i compile source file ( ArduinoSoundLevelMeter.ino in according your advise ( include mic gnd connect arduino uno gnd , arduino uno aref connect arduino uno 3.3v and mic vcc , mic ao connect arduino uno ao .
But i found dB is -15.00 normally , if we speak loudly , the dB is -6.00 normally ,
Maybe it will be error value for us , if possible , please give me some advisement .
Time: 53 Amp: Max: 21% Avg: 17% RMS: 25% dB: -15.001
Time: 53 Amp: Max: 21% Avg: 17% RMS: 25% dB: -14.963
Time: 54 Amp: Max: 21% Avg: 17% RMS: 25% dB: -14.880
Time: 53 Amp: Max: 22% Avg: 17% RMS: 25% dB: -14.915
Time: 53 Amp: Max: 21% Avg: 17% RMS: 25% dB: -14.967
Time: 54 Amp: Max: 22% Avg: 17% RMS: 25% dB: -14.955
Time: 53 Amp: Max: 22% Avg: 17% RMS: 25% dB: -14.878
Time: 53 Amp: Max: 22% Avg: 17% RMS: 25% dB: -14.936
Time: 53 Amp: Max: 21% Avg: 17% RMS: 25% dB: -14.979
Hi Tiger,
Doesn’t sound like your values are bad. They could be correct. What kind of microphone module are you using?
If you make louder sounds, does it go higher than -6?
If you want to try another way of looking at it, try undefining FreqLog and watching the result values. Those won’t be in dB but in 8bit magnitude numbers.
Hello Dear Arik:
Thanks for your advisement , Whether i need adjust AmpMax ( #define AmpMax (1024 / 8) ) for realizing positive number ? as your saying , dB value is Relative value 。
float dB = 20.0*log10(soundVolRMSflt/AmpMax);
this is my sound sensor , maybe i will replace lm388 with MAX4466 later.
https://item.taobao.com/item.htm?spm=a1z09.2.0.0.2ed6e797n6R44y&id=36836608948&_u=38pbglf105f
ic is lm388
Best Regards
Tiger
Hi Tiger,
I would not change AmpMax unless the max of your microphone behaves in a special way. If you want to add gain in software, use VolumeGainFactorBits.
dB is a relative metric! It is common to define max volume as 0 and have the measurements as negative numbers relative to that. However, other reference points can be set. See a discussion above about calibrating the measurements to a standard reference of “20 micropascals”.
Of course you can just add some constant value (for example 20) to your dB reading to make it “look” positive.
I have not used it personally, but an LM388 should do the job just fine.
Hello,
thank you for Publishing your awesome Project.
It’s probably obvious but where does the factor 10000001 in this line
“long sample_rate = FHT_N * 1000000l / dt;”
come from?
Best Regards
Hi Max,
It is “1,000,000 L”, where L stands for the type “long”. Therefore, the value is 1M not 10M and 1. The factor 1M is for the number if ms in one second.
Cheers,
Arik.
thanks, i updated VolumeGainFactorBits value to 10, but db value is NAN
Hi Tiger,
A value of 10 for VolumeGainFactorBits means a gain of 2^10 .
I have not tried with such a high gain. It is possible that for such a scaling the values overflow at some point.
I suggest you try smaller gain first and debug the code to find out where it fails for VolumeGainFactorBits=10
Regards,
Arik.
ok,and i replace perious part with max4466 just now,db value was -10.5 normally, if i speak loudly,and db value will be -2.49
Hi, first of all congratulations for this excellent project. Im really looking forward finishing my noise meter, however im trying to get as much accuracy as possible. Have you tried using this module (https://www.amazon.com/gp/product/B00SOY52CU/ref=oh_aui_detailpage_o00_s00?ie=UTF8&psc=1) for getting a 16 bits signal?
Thanks for all
Hi Francisco,
What you linked to is a DAC. I have not used it. It has no microphone so you will need to connect one properly. Another issue to mind is that it has a sample rate of 860 samples/second. This is relatively low for audio. You will only be able to identify frequencies of about 400hz and lower.
Arik.
Hi Yavilevich,
Thank you so much for sharing such valuable experience. I really appreciate it and will all the success in your project.
I found Grove – Loudness Sensor and I was wondering if you please tell me if what do you think about it in term of its capability of measuring noise level?
Do you think it possible to use your code for this specific sensor?
Thank you in advance.,
Grove – Loudness Sensor it uses chip LM2904
Hi Soliman,
I have no experience with this module. It looks ok and will probably do fine for sound level measurement.
As it does filtering and returns a positive envelop it will not work as a spectrum analyzer.
Regards,
Arik.
Hi, thank you for your great work and nice theory explanation.
I would like to build a sound meter for tube guitar amps comparison. You can see in this video:
https://www.youtube.com/watch?v=xaSQBleWD2M&t=15s
It does not matter where arduino feeds. Electret mic (I have HXJ-17) or line level signal from speaker output.
I need to display it. With 7 segment led display like in video, may be.
Do you have any suggestion to me?
Thank you.
Hi Steve,
Just follow the instructions in the article and show the result on a display instead of sending it via a serial connection.
Hi, what if I want to use 5V module. is there any suitable coding?
I’m use this module for my robot. I have problem with my 3.3 V input module. hence I need to use 5V.
Hi Naiemah,
Not sure what you are asking. Which module are you talking about?
hi arik
thanks for your very useful article as a reference for my final assignment ..
I have a project for my final project using analog sound sensor v2.
sorry before .. i’m still very beginner for arduino.o programming i want to calculate the LEQ value of lunch (Ls), night LEQ (Lm) and LEQ daytime (Lsm) ..
I am still confused by how to calculate the output value .. because I know that the output of the analog value of the sensor sound v2 is still worth the bit.
is there any suggestion suggestion for me ?? so i can fix the error?
o yah .. i will attach the program code ..
void setup()
{
Serial.begin(9600); // open serial port, set the baud rate to 9600 bps
}
void loop()
{
int val;
val=analogRead(0); //connect mic sensor to Analog 0
Serial.println(val,DEC);//print the sound value to serial
delay(100);
}
Hi Sandy,
I suggest you first implement the code in the article and see that you can calculate the dB value of the sound. From there adapt it to what you need to calculate (which I am not familiar with).
Arik, thanks for your work on this. I’m currently working on a project that this will go a long way to taking the hard work out of but I’m having a bit of trouble and wondered if you could help!?
Background is I have a race car where I need a sound activated exhaust valve (closing to reduce noise when it gets to a certain level) to stay within permitted decibel range. I have a motorcycle exhaust valve and actuator which is a motor with built in petentiometer. I’ve set it up so it initialises itself in void setup (sweeps back and fourth between fully open, closed and open again) then runs through your code for sound level monitoring to constantly adjust itself….the problem I have is I seem to be unable to use the analog read of the 5v petentiometer, I wondered if this was due to all the code you’ve implemented in your example settting use of 3.3v and voltage ARef etc. The pot on the motor is hooked up to 5v and the call seems to just halt the serial output debugging I’ve implemented?
The final solution I intend on implementing is to use two mic’s to try and avoid environmental triggering of the exhaust valve due to other cars etc. But for now just being able to get the simplified version with one is my goal. If you have any other ideas I’m open to suggestions.
Hi Paul,
Interesting application.
I wouldn’t expect the code to halt in this situation. Hard to say why it happens without seeing the code. You are welcome to pastebin it if you like.
You can pass 3.3V to your pot instead of 5V to make it more voltage-compatible with the rest of the system. However, higher voltage than reference should just give the max value, it shouldn’t crash the system/call. So I guess the issue is more complex. Perhaps something with where you are reading the pot.
Try to disable some of the default modes (ADCReClock, ADCFlow, Use3.3) and see what happens.
Arik,
Thanks for the quick reply! I have numerous interesting projects on the go which is why I’m asking for help rather than battling my way through.
I’ve created a pastebin:
https://pastebin.com/QWeP6SWh
I’m no C programmer so it may or may not be an obvious issue. There also might be a better way to implement the logic so feel free to suggest any changes.
Ok, so at what point does it get stuck? What is printed on the serial up to that point?
Arik,
further info is that I’m using l293d to control the motor and max4466 for the mic:
https://www.ebay.co.uk/itm/Mini-Motor-Drive-Shield-Expansion-Board-L293D-Module-For-Arduino-Raspberry-Pi-uk/222444550581?epid=2136070438&hash=item33caba79b5:g:Q6QAAOSwA3dYeotW
Arik,
It completes lines 133 – 139 ourtputting your serial output lines and my RefDbValue (I put multiple calls in because I can only assume the mic input takes some time to initialise before valid values are generated). After that nothing, which I assume is halting on the void loop call to update the pot value line 149 as 150 isn’t printed.
If I comment out 149, 150, 216, 218, 224, 226 then the motor spins in one direction until noise is made at which point it moves in the opposite direction…..this is the behaviour I want but ultimately with more control and position information from the pot to ensure it only either goes to fully opened or fully closed.
To me it’s def the call to the analog pot pin 1 that seems to be the issue.
Hi Paul,
Nothing jumps out to be as being wrong. I suggest you add more debug prints and do debugging in general to see what is going on. Perhaps you should sit with a more experienced programmer for this task.
Good luck!
Arik,
I managed to try your suggestion of disabling ADC, 3.3v and ADCreclock. Doing that means I’m able to call and retrieve the pot value and get the actuator working as required.
Working through the different iterations disabling 3.3v and ADCFlow and having ADCReClock enabled is the only variation that works.
Now I’ve got past that I can focus on the logic for efficient and effective sound suppression with the least performance degradation…..and also saving the reference dB value for power off / on use. Long way to go but at least I have the basics.
Thanks for your help.
Hi Paul, thanks for the update.
Good to see that you managed. I guess something is incompatible between the regular analogRead and the special customizations above. Unfortunately I don’t have the time to look at that at the moment. Just disable anything that makes trouble and perhaps in the future I will release an updated version.
Hi Arik,
I’m wish only to read the values of sound in dB. I’d amplified th microphone output by 100 before to enter in Arduino. I alsp use a sound level meter, placed near this microphone. The source of sound is a buzzer of about 3kHz. When I measure on the instrument from 50 to 90 dB, in the Arduino serial monitor I see from -8.6 to -8.3. Can you explain me where are my mistakes?
Thank you.
The code:
// calculate volume level of the signal and print to serial and LCD
void MeasureVolume()
{
long soundVolAvg = 0, soundVolMax = 0, soundVolRMS = 0, t0 = millis();
//cli(); // UDRE interrupt slows this way down on arduino1.0
for (int i = 0; i < MicSamples; i++)
{
#ifdef ADCFlow
while (!(ADCSRA & /*0x10*/_BV(ADIF))); // wait for adc to be ready (ADIF)
sbi(ADCSRA, ADIF); // restart adc
byte m = ADCL; // fetch adc data
byte j = ADCH;
int k = ((int)j << 8) | m; // form into an int
#else
int k = analogRead(MicPin);
#endif
int amp = abs(k – AmpMax);
amp <<= VolumeGainFactorBits;
soundVolMax = max(soundVolMax, amp);
soundVolAvg += amp;
soundVolRMS += ((long)amp*amp);
}
soundVolAvg /= MicSamples;
soundVolRMS /= MicSamples;
float soundVolRMSflt = sqrt(soundVolRMS);
//sei();
float dB = 20.0*log10(soundVolRMSflt/AmpMax);
// convert from 0 to 100
soundVolAvg = 100 * soundVolAvg / AmpMax;
soundVolMax = 100 * soundVolMax / AmpMax;
soundVolRMSflt = 100 * soundVolRMSflt / AmpMax;
soundVolRMS = 10 * soundVolRMSflt / 7; // RMS to estimate peak (RMS is 0.7 of the peak in sin)
// print
Serial.print("Time: " + String(millis() – t0));
Serial.print(" Amp: Max: " + String(soundVolMax));
Serial.print("% Avg: " + String(soundVolAvg));
Serial.print("% RMS: " + String(soundVolRMS));
Serial.println("% dB: " + String(dB,3));
}
Hi Leo,
Please post results of “MeasureAnalog” function. Once for no buzzer and once with buzzer. Also specify if you are using the 3.3V or 5V with the microphone and ADC.
Hi Arik,
supply is 3.3V.
The measures are in order: MIN,MAX,AVG,SPAN.
Without buzzer:
294-352-323-58,29,29
318-332-322-21,11,10
With buzzer:
219-404-323-185,81,104 with 90db
245-399-323-154,76,78 with 80db
Thanks!
Hi Leo,
These values don’t look good. What is your hardware setup? What mic module? How is gain implemented?
Hi Arik,
the microphone is like SPQ1410HR5H-B, amplified 100 in non inverting mode by a operational amplifier first to enter in a Arduino uno
Hi Leo,
The article above assumes your circuit provides a signal that is biased at Varef/2 and that is Varef peak-to-peak.
What you have is certainly different. Unfortunately, I am not familiar with the part you are using and can’t help you connect it.
Hi Arik,
I’d modified the circuit. Now the values are:
without buzzer
396-404-400-8,4,4
with buzzer
301-479-400-178,79,99
are that measures accetable?
Hi Leo,
Not for the code in this article as-is, but you may be able to modify the code for your purpose.
Your DC base is at 400/1024=~0.4Varef. You need to understand why that is like that or alter the code for your value.
Your “span” is relatively small for such a loud sound. 178 peak-to-peak might suggest you need a bigger gain. You would be better with a span that is closer to 1024, to benefit from the full ADC range.
If you post your mic circuit perhaps somebody will have additional suggestions.
const int sampleWindow = 50;
unsigned int sample;
void setup()
{
Serial.begin(9600);
}
void loop()
{
unsigned long startMillis = millis();
unsigned int peakToPeak = 0;
unsigned int signalMax = 0;
unsigned int signalMin = 1024;
//collect data for 50ms
while (millis() – startMillis < sampleWindow)
{
sample = analogRead(0);
if (sample signalMax)
{
signalMax = sample;
}
else if (sample < signalMin)
{
signalMin = sample;
}
}
}
peakToPeak = signalMax – signalMin;
double volts = (( (peakToPeak + 1) * 3.3) / 1024);
double first = 20 * log10 (volts / 0.00158);
double second = first + 94 – 56;
Serial.println(second);
delay(1000);
}
Pingback: how to connect audio output to dac | Physics Forums - The Fusion of Science and Community
hi Arik ,
i made the same circut, with the same components, but a i have this values:
reference: 50db
#define AmpMax (1024 / 2)
#define MicSamples (1024*2)
Time: 53 Amp: Max: 0% Avg: 0% RMS: 0% dB: -47.196
Time: 53 Amp: Max: 0% Avg: 0% RMS: 0% dB: -47.196
Time: 53 Amp: Max: 0% Avg: 0% RMS: 0% dB: -47.196
Time: 54 Amp: Max: 0% Avg: 0% RMS: 0% dB: -47.196
Time: 53 Amp: Max: 0% Avg: 0% RMS: 0% dB: -47.196
#define AmpMax (509 / 2)
#define MicSamples (509*2)
Time: 26 Amp: Max: 103% Avg: 100Starting mic demo
Time: 26 Amp: Max: 104% Avg: 100% RMS: 143% dB: 0.060
Time: 27 Amp: Max: 104% Avg: 100% RMS: 144% dB: 0.071
Time: 27 Amp: Max: 105% Avg: 100% RMS: 143% dB: 0.067
Time: 27 Amp: Max: 105% Avg: 100% RMS: 143% dB: 0.051
Time: 27 Amp: Max: 105% Avg: 100% RMS: 144% dB: 0.074
Time: 27 Amp: Max: 104% Avg: 100% RMS: 143% dB: 0.057
//Configuração da amplitude da onda e amostragem
#define AmpMax (510 / 2)
#define MicSamples (510*2)
Time: 26 Amp: Max: 103% Avg:Starting mic demo
Time: 26 Amp: Max: 103% Avg: 99% RMS: 142% dB: -0.010
Time: 27 Amp: Max: 103% Avg: 99% RMS: 142% dB: -0.015
Time: 27 Amp: Max: 103% Avg: 99% RMS: 142% dB: -0.006
Time: 26 Amp: Max: 101% Avg: 99% RMS: 142% dB: -0.002
what am I doing wrong?
Hi Felipe,
Please post results of “MeasureAnalog” function. Have you made any changes in code, components or schematic vs what is described in the article?
Hi, Arik!
i´m using a arduino nano with max 4466. Aref with 3.3v, anda the max4466 with 3.3v. the code is the same.
My results of MeasureAnalog
#define AmpMax (1024 / 2)
#define MicSamples (1024*2)
Time: 53 Min: 0 Max: 600 Avg: 324 Span: 600, 276, 324
Time: 53 Min: 494 Max: 575 Avg: 514 Span: 81, 61, 20
Time: 53 Min: 2 Max: 1023 Avg: 676 Span: 1021, 347, 674
Time: 55 Min: 499 Max: 523 Avg: 510 Span: 24, 13, 11
Time: 53 Min: 0 Max: 611 Avg: 335 Span: 611, 276, 335
Time: 53 Min: 493 Max: 526 Avg: 508 Span: 33, 18, 15
Time: 53 Min: 1 Max: 1023 Avg: 677 Span: 1022, 346, 676
Time: 53 Min: 0 Max: 523 Avg: 377 Span: 523, 146, 377
Time: 53 Min: 0 Max: 601 Avg: 488 Span: 601, 113, 488
Time: 55 Min: 1 Max: 1023 Avg: 590 Span: 1022, 433, 589
Time: 53 Min: 499 Max: 807 Avg: 539 Span: 308, 268, 40
Time: 53 Min: 0 Max: 558 Avg: 323 Span: 558, 235, 323
Time: 54 Min: 496 Max: 609 Avg: 516 Span: 113, 93, 20
Time: 53 Min: 2 Max: 1023 Avg: 677 Span: 1021, 346, 675
Time: 53 Min: 0 Max: 524 Avg: 410 Span: 524, 114, 410
Time: 54 Min: 0 Max: 620 Avg: 467 Span: 620, 153, 467
Time: 53 Min: 1 Max: 1023 Avg: 520 Span: 1022, 503, 519
Time: 53 Min: 498 Max: 1023 Avg: 607 Span: 525, 416, 109
Time: 53 Min: 0 Max: 520 Avg: 338 Span: 520, 182, 338
Time: 53 Min: 1 Max: 1023 Avg: 592 Span: 1022, 431, 591
Time: 54 Min: 0 Max: 1023 Avg: 537 Span: 1023, 486, 537
Time: 53 Min: 0 Max: 1023 Avg: 465 Span: 1023, 558, 465
Time: 53 Min: 498 Max: 659 Avg: 518 Span: 161, 141, 20
Time: 54 Min: 0 Max: 980 Avg: 511 Span: 980, 469, 511
Time: 53 Min: 496 Max: 523 Avg: 509 Span: 27, 14, 13
Time: 54 Min: 0 Max: 1023 Avg: 510 Span: 1023, 513, 510
Time: 54 Min: 499 Max: 519 Avg: 509 Span: 20, 10, 10
Time: 53 Min: 0 Max: 1023 Avg: 509 Span: 1023, 514, 509
These results look pretty random to me. As if no meaningful source is connected. What micro-controller do you have on your Nano? Post a clear schematic/photo of your circuit. Try to undefine ADCFlow and see if things change.
Arik,
Could you please send me your email, so I can send you my project and more details?
i´m using arduino nano 328p, with a 12v power supply, an LM1117 to create a 3.3 bus for esp8266 and the mic max 4466.
output 3.3 of arduino connected directly to aref.
Thank you for your help and attention!
Pingback: Die Post war da - Februar 2018 - Björns Techblog
Hello
I want to read the frequency with a MAX4466, to get the value and use it to move a motor.
I try to use your MeasureFHT() program, but I don’t receive a usable value.
Pingback: KW.8 2018 - Lautstärkepegel und UV-Index - Björns Techblog
Arik, thanks for your work on this.
So far I could run your work (code) on a Arduino Uno R3 with a MAX4466. (With 3,3V) When I switched to the FHT and watched that with the Processing Tool I got results but also a lot of noise. Is that normal?
Reason or target:
I am working on a projekt where I try to identify different sounds of Akku driven powertools. My Aim is to run a process always when a spezial sound of powertool appears. The sezial sound I would try to indentify via FHT and spezial weights of Frequenzies.
In general could this work?
Thanks in advance
Andi
Hi Andi,
Regarding noise, you should expect some noise. Can’t say how much and not sure what “a lot of” is. In the end these parts are simple and are not for accurate measurements. Try to apply some averaging if you see that the readings jitter too much.
Regarding your project, there is no yes or no answer. I feel this is achievable to some degree and detection certainty. Depends on your requirements and skills with signal processing / machine learning algorithms.
Hi Arik,
would you think that I could achive better results with the arduino zero. href=”https://www.arduino.cc/en/Tutorial/SimpleAudioFrequencyMeter”>
I want to try that also..
Hi Andi,
The board is not the main issue.
The library in the tutorial you linked to seems to measure only one frequency. This is different from a spectrum analyzer. It is up to you to determine if that is applicable to your problem.
Hi Arik,
Is the FHT example code usable also with Arduino Leonardo. It compiled, but when I run it with FHT_128_channel_analyser, the graph has some values, but they are not changing at all.
Thanks in advance!
Hi Avar,
The code was written for the Uno/Nano and their ATmega328P micro-controller. You would need to port the code if you want to use it on a different board. Focus on the parts where there is work with registers: timers, stream reading from ADC, etc.
Hi Arik,
thanks for your work on this. I’m trying to create a simple audio spectrum analyzer and I’m using LM386 for amplify the signal from the microphone. My goal is to calculate the THD (total harmonic distortion) but I need the RMS value of the harmonics according the equation 1. The element of the output array fht_log_out is uint8_t, but I need the RMS value. How can obtain these values ? Where am I doing wrong?
Thanks in advance!
Hi Marcello,
Each FHT will give you one element per specific frequency. If you need a _mean_ value of a specific frequency you would need to run FHT a few times and do RMS on the various values you will receive for each frequency. RMS of just one value is the value itself and you can start with that for simplicity.
Take a look at https://en.wikipedia.org/wiki/Root_mean_square
Hi Arik ,
ok I understand. But the output of the FHT are FHT bin (8 bit). How can I use these value to calculate the value of the Harmonic in Volt ? Because the FHT input is an array with the samples of the voice signal (that is in volt and then converted in digital with the ADC)
Thanks a lot.
Hi Marcello,
I see. Well, unless you changed other parts of the code/circuit, 3.3V would be max ADC, so I assume max 8bit (255) would mean 3.3V.
Try to feed the algorithm k=1024 instead of the value read from analogRead()/ADCH and see what would be the value of your first frequency bin. That should help you make a match between max voltage and max FHT bin value. Let us know the result in the comments.
and it might help to review the documentation at
http://wiki.openmusiclabs.com/wiki/ArduinoFHT
and
http://wiki.openmusiclabs.com/wiki/FHTFunctions
hey Arik
thanks for your help
do you how I can write a code for an Arduino with light, I want the light start to go on when the mikrofon rekord some load sound.
I hobe that you can help me
Adam.
Hey Arik,
Thanks for this detailed post! I am using an Arduino Leonardo, and the MAX4466 with 3.3VRef.
I read through the comments and did some troubleshooting on my end by i cant seem to figure out the problem with the ADCFlow issue im having…
Doing a normal analogRead i get very nice sinwave graphed values centered at right above 500. But when i try using the ADCFlow with any routines in the loop i get 0’s with an occasional jump to 1 or 2…. Any suggestions on what i should try?
Hi DNice,
See my reply to Avar above. The Leonardo has a different micro controller. You would need to port any uC specific code to the new platform to make it work.
Hello Arik,
Thank you very much for sharing this work. I had tried this out, but receive the compile error below. I appreciate any help! ERROR:
Arduino: 1.8.4 (Windows 10), Board: “Arduino Nano, ATmega328P”
WARNING: Category ‘Language’ in library ArduinoStreaming is not valid. Setting to ‘Uncategorized’
In file included from C:\Users\enduser\Downloads\ArduinoSoundLevelMeter-master\ArduinoSoundLevelMeter\ArduinoSoundLevelMeter.ino:7:0:
C:\Users\enduser\Documents\Arduino\libraries\FHT/FHT.h:178:3: warning: invalid suffix on literal; C++11 requires a space between literal and string macro [-Wliteral-suffix]
“ldi r16, “STRINGIFY(FHT_N/8)” \n” // prep loop counter
^
C:\Users\enduser\Documents\Arduino\libraries\FHT/FHT.h:379:3: warning: invalid suffix on literal; C++11 requires a space between literal and string macro [-Wliteral-suffix]
“ldi r16, hi8((fht_input + “STRINGIFY(FHT_N*2)”)) \n” // prep end of dataspace register
^
C:\Users\enduser\Documents\Arduino\libraries\FHT/FHT.h:574:3: warning: invalid suffix on literal; C++11 requires a space between literal and string macro [-Wliteral-suffix]
“cpi r28, lo8(fht_input + “STRINGIFY(FHT_N*2)”) \n” // check if at end of dataspace
^
C:\Users\enduser\Documents\Arduino\libraries\FHT/FHT.h:588:3: warning: invalid suffix on literal; C++11 requires a space between literal and string macro [-Wliteral-suffix]
“sbrc r8, “STRINGIFY(LOG_N – 2)” \n” // check if finished with all butteflies
^
C:\Users\enduser\Documents\Arduino\libraries\FHT/FHT.h:644:3: warning: invalid suffix on literal; C++11 requires a space between literal and string macro [-Wliteral-suffix]
“ldi r20, “STRINGIFY((FHT_N/2) – _R_V)” \n” // set to first sample
^
C:\Users\enduser\Documents\Arduino\libraries\FHT/FHT.h:718:3: warning: invalid suffix on literal; C++11 requires a space between literal and string macro [-Wliteral-suffix]
“ldi r30, lo8(fht_input + “STRINGIFY(FHT_N*2)”) \n” // set to end of data space
^
C:\Users\enduser\Documents\Arduino\libraries\FHT/FHT.h:719:3: warning: invalid suffix on literal; C++11 requires a space between literal and string macro [-Wliteral-suffix]
“ldi r31, hi8(fht_input + “STRINGIFY(FHT_N*2)”) \n”
^
C:\Users\enduser\Documents\Arduino\libraries\FHT/FHT.h:722:3: warning: invalid suffix on literal; C++11 requires a space between literal and string macro [-Wliteral-suffix]
“ldi r20, “STRINGIFY(FHT_N/2)” \n” // set loop counter
^
C:\Users\enduser\Documents\Arduino\libraries\FHT/FHT.h:875:3: warning: invalid suffix on literal; C++11 requires a space between literal and string macro [-Wliteral-suffix]
“ldi r30, lo8(fht_input + “STRINGIFY(FHT_N*2)”) \n” // set to end of data space
^
C:\Users\enduser\Documents\Arduino\libraries\FHT/FHT.h:876:3: warning: invalid suffix on literal; C++11 requires a space between literal and string macro [-Wliteral-suffix]
“ldi r31, hi8(fht_input + “STRINGIFY(FHT_N*2)”) \n”
^
C:\Users\enduser\Documents\Arduino\libraries\FHT/FHT.h:879:3: warning: invalid suffix on literal; C++11 requires a space between literal and string macro [-Wliteral-suffix]
“ldi r20, “STRINGIFY(FHT_N/2)” \n” // set loop counter
^
C:\Users\enduser\Documents\Arduino\libraries\FHT/FHT.h:1056:3: warning: invalid suffix on literal; C++11 requires a space between literal and string macro [-Wliteral-suffix]
“ldi r30, lo8(fht_input + “STRINGIFY(FHT_N*2)”) \n” // set to end of data space
^
C:\Users\enduser\Documents\Arduino\libraries\FHT/FHT.h:1057:3: warning: invalid suffix on literal; C++11 requires a space between literal and string macro [-Wliteral-suffix]
“ldi r31, hi8(fht_input + “STRINGIFY(FHT_N*2)”) \n”
^
C:\Users\enduser\Documents\Arduino\libraries\FHT/FHT.h:1060:3: warning: invalid suffix on literal; C++11 requires a space between literal and string macro [-Wliteral-suffix]
“ldi r20, “STRINGIFY(FHT_N/2)” \n” // set loop counter
^
C:\Users\enduser\Documents\Arduino\libraries\FHT/FHT.h:1214:3: warning: invalid suffix on literal; C++11 requires a space between literal and string macro [-Wliteral-suffix]
“ldi r20, “STRINGIFY(((FHT_N)&(0xff)))” \n”
^
C:\Users\enduser\Documents\Arduino\libraries\FHT/FHT.h:1291:3: warning: invalid suffix on literal; C++11 requires a space between literal and string macro [-Wliteral-suffix]
“ldi r30, lo8(fht_input + “STRINGIFY(FHT_N*2)”) \n” // set to end of data space
^
C:\Users\enduser\Documents\Arduino\libraries\FHT/FHT.h:1292:3: warning: invalid suffix on literal; C++11 requires a space between literal and string macro [-Wliteral-suffix]
“ldi r31, hi8(fht_input + “STRINGIFY(FHT_N*2)”) \n”
^
C:\Users\enduser\Documents\Arduino\libraries\FHT/FHT.h:1444:3: warning: invalid suffix on literal; C++11 requires a space between literal and string macro [-Wliteral-suffix]
“sbrs r21, “STRINGIFY((LOG_N) – 1)” \n” // check if done
^
C:\Users\enduser\Downloads\ArduinoSoundLevelMeter-master\ArduinoSoundLevelMeter\ArduinoSoundLevelMeter.ino:17:13: warning: ISO C99 requires whitespace after the macro name
#define Use3.3 // use 3.3 voltage. the 5v voltage from usb is not regulated. this is much more stable.
^
C:\Users\enduser\Downloads\ArduinoSoundLevelMeter-master\ArduinoSoundLevelMeter\ArduinoSoundLevelMeter.ino:53:13: warning: extra tokens at end of #ifndef directive
#ifndef Use3.3
^
In file included from C:\Users\enduser\Downloads\ArduinoSoundLevelMeter-master\ArduinoSoundLevelMeter\ArduinoSoundLevelMeter.ino:7:0:
C:\Users\enduser\Documents\Arduino\libraries\FHT/FHT.h:72:10: error: ‘prog_int16_t’ does not name a type
PROGMEM prog_int16_t _cas_constants[] = {
^
In file included from C:\Users\enduser\Downloads\ArduinoSoundLevelMeter-master\ArduinoSoundLevelMeter\ArduinoSoundLevelMeter.ino:7:0:
C:\Users\enduser\Documents\Arduino\libraries\FHT/FHT.h:87:12: error: ‘prog_uint8_t’ does not name a type
PROGMEM prog_uint8_t _reorder_table[] = {
^
In file included from C:\Users\enduser\Downloads\ArduinoSoundLevelMeter-master\ArduinoSoundLevelMeter\ArduinoSoundLevelMeter.ino:7:0:
C:\Users\enduser\Documents\Arduino\libraries\FHT/FHT.h:103:12: error: ‘prog_uint8_t’ does not name a type
PROGMEM prog_uint8_t _log_table[] = {
^
In file included from C:\Users\enduser\Downloads\ArduinoSoundLevelMeter-master\ArduinoSoundLevelMeter\ArduinoSoundLevelMeter.ino:7:0:
C:\Users\enduser\Documents\Arduino\libraries\FHT/FHT.h:120:12: error: ‘prog_uint8_t’ does not name a type
PROGMEM prog_uint8_t _lin_table8[] = {
^
In file included from C:\Users\enduser\Downloads\ArduinoSoundLevelMeter-master\ArduinoSoundLevelMeter\ArduinoSoundLevelMeter.ino:7:0:
C:\Users\enduser\Documents\Arduino\libraries\FHT/FHT.h:131:12: error: ‘prog_int16_t’ does not name a type
PROGMEM prog_int16_t _window_func[] = {
^
exit status 1
Error compiling for board Arduino Nano.
This report would have more information with
“Show verbose output during compilation”
option enabled in File -> Preferences.
Hi Kasey,
I am unable to reproduce. Have you made any changes to the code?
Check your FHT library version. The FHT.h files should contain the following text in the top:
/*
FHT for arduino – hartley transform
guest openmusiclabs.com 9.1.12
this is a speed optimized program
for calculating an N point FHT on a block of data
please read the read_me file for more info
modded 7.7.14 – fixed progmem for new avr-gcc (thanks to forum user kirill9617)
*/
If that is not what you have, try an updated library.
Hello Arik Yavilevich, my name is Bill, congratulations for the work is helping many people. I am trying to reproduce this project for college, but it is not reproducing any value in the input A0 nor arduino serial print, I am using the LM393 sensor, which is sending signals in maximum amplification, but does not change anything in the lcd. do I have to change something in the code to work? I’m a newbie in the arduino study area. I’m from Argentina and I’m waiting for an answer.
Hi Bill,
The LM393 is a comparator and might not work correctly for this purpose.
What are you trying to accomplish?
Please include a diagram of your circuit and any changes you have made to the original course code.
Imagen of the Serial Print
The code is the same as you offered on the site, without changes, even with the lm393 was to be variations on the port AO. but, the values do not change.
I want to measure the sound and then measure its waveforms.
This
is protoboard circuit.
Hi Bill,
The module looks like a sound detection module. As described above in the article, such modules have a digital output (only HIGH/LOW) and not a waveform of the sound.
Please post results of the “MeasureAnalog” function. It is a good way to see what data you are getting and to troubleshoot the situation.
Hi Arik, thanks for your replying, finally i can run the code, thank you very much.
Hi Arik. We are working on a project that needs to locate the direction of the sound source and we need to use FFT. Is it possible to have a real-time analysis of data using FFT?
Hi Dawn,
Yes. The project described in this article is doing real-time analysis of sound from a mic using FHT (FFT). No idea if this can help to locate the direction of the sound.
Pingback: Fast Analog Read on Arduino | Peter F. Klemperer
Hi Arik.Thank you so much for this amazing piece of work and for your dedication to it.You’ve really simplified signal processing,analog and micro-controller electroncics and coding in one sweep for some of us.
I have a question,is it possible to store the FHT output in the arduino like a template and use it for comparison with other FHT inputs?If so ,could you kindly share the code in arduino?Thank you in advance and looking forward to your feedback.
Hi Trevor,
Thanks for the positive feedback.
What you have described should be possible, though you only mentioned it at a high level and you would need to decide how such comparison algorithm would work. There could be infinite ways to compare two FHT sequences.
I have not dealt with this problem and don’t have relevant code to share. I would suggest to search for best practices of comparing FFT captures and locate an algorithm that will fit your case. Mind for memory requirements, as storing several FHT outputs might require more memory than basic Arduinos have.
Thanks Arik for the feedback.I will research more.However i have come across the auto-correlation technique in most literature.I will delve into more research.Thanks once again.
I am now considering using raspberry pi as u advised because of the more memory and processing capability.Any effective FHT or FFT libraries you could recommend that do an efficient job and require less computations?
Hi Trevor,
Unfortunately I can’t recommend anything for the pi, but I am sure there are plenty of options as well as processing power on that platform.
Thanks Arik.Much appreciated.Could you recommend some of the ways one can compare two FFT outputs?
Hi Trevor,
I have not dealt with this challenge so I have no recommendations. 🙁
Hi Arik,
Well first of all, thank you !
Your article is simply awsome and so well written, I understood a lot of things thanks to you.
Really, this helped me so much.
But I still have a few questions if you don’t mind.
My skills in Arduino are limited yet I have tried the part concerning only the sound volume and the FasterADC but the Serial monitor displays wrong values,
completely idle no matter what the sensor probes.
Those are : “Time: 53 Amp: Max: 99% Avg: 99% RMS: 142% dB: -0.017”.
The MeasureAnalog() function displays “Time: 53 Min: 1023 Max: 1023 Avg: 1023 Span: 0, 0, 0
”
All the pins are well connected and I even tried with several gain modes.
So the AnalogRead is not returning anything, something ain’t right with the ADC I think.
I don’t know where is the problem.
And I’m still searching where to change the ADC freq. divider mode, is it “ADCSRA = 0xe0+7;” ? And if changed, is there something else to change ?
I have the Arduino UNO R3 and the AdafruitSensor w/ MAX4466 at the highest gain value (125%).
Thanks.
Hi Iann,
If MeasureAnalog prints “Min: 1023” it means that your mic input always gives constant value=AnalogVRef. Something is not right and it is probably the circuit. You will not be able to get any meaningful values as long as this is the case.
Try reducing the gain and double checking your circuit. If it doesn’t help post photo+schematic of your circuit as well as a pastebin of the code you are using.
Thank you for your answer !
After checking with an ohmmeter, it was indeed a false contact with the AREF pin.
I get some values now, but they don’t look like dB. (still negative, but changing).
I tried to put a ref value and added a value in the formula to match with my sound meter (SPM01 TackLife) but the minimal dB (displayed 40dB by the soundmeter) is to high (57dB).
Anyway, the code looks like this :
[code removed]
Hi Iann,
If you have made a change to your circuit/ARef then you should start from basics again before going to dB calculations. By that I mean running “MeasureAnalog” and checking that you get expected min,max,avg values. If you intend to send code, please use https://pastebin.com/ instead of pasting it as text in the comment.
Hi,
Sorry for the bad paste/copy
Everything is well connected and I get satisfying values
(Time: 27 Min: 510 Max: 511 Avg: 510 Span: 1, 1, 0).
The dB level is still negative though
Hi, these values are not that good. You are getting a flat signal. Your min and max are practically the same.
Try to make some noise or increase the gain. Min and max should go farther apart and Span should increase.
My mistake, it was with no ambient sound.
when blowing on it I get about :
” Time: 27 Min: 0 Max: 1022 Avg: 550 Span: 1022, 472, 550″
A value between 0 and 1022 seems right to me
Looks good then. dB is negative per how the reference point for dB is defined in this article. It is explained above.
Hi Arik,
First, thank you for this wonderful work on sound analysis. In particular, I am trying to learn from you and apply this to control color of Neopixels (or equiv 3-wire LEDs). Although I was GA Tech educated B.E.E., that was 1970 and, at 70 years of age, I have lost much of my hi-tech moxy. :-/
I lean very heavily upon others help but I do put in days and days of trial-and-error with my code and breadboards. Yet, after weeks of doing this, I am kind of stuck and after reading your blog, I am hoping that you have already figured this out. Here’s the question in a nutshell.
I have my analog audio input on the Arduino pin A0, and, I did manage to implement code for FFT processing to drive an OLED in the frequency domain. However, I have yet to understand and figure out how to convert the output of this processing to a I2C data stream for controlling color based upon the frequency. This has been done by others and I see evidence of it on YouTube. However, getting any real insight and specifically help with coding is non-existent. If you have already thought this through and have helped others with it, please point me in that direction. I would not ask you to spend time on such a difficult topic for my own purposes but if other sections of your blog have covered this topic (I did a cursory search), I will study it and experiment with that new knowledge. Regardless, thank you once again for this blog. Not only is it chocked full of exceptional technical advice, it’s written eloquently. Live long and prosper.
Hi Bill,
Sounds like an interesting project. I am not sure I fully understand where you are having an issue. I have not tried to connect the frequency result to any lighting so can’t say from experience. Here are some pointers:
Do each part separately. Make sure you can do FFT and print the result to serial and separately light your Neopixels in any way you need them to be lit.
Then decide how the FFT array will map to the colors. For example, if you have one RGB LED then you can divide the FFT array to 3 parts and the sum of each part (normalized) will set each of the 3 colors.
Then where the FFT result is getting printed, write your mapping algorithm and send the values to part 2 of the code.
You mention I2C but I am not sure in what context it is used. Naturally you should use relevant libraries for your project, such as Neopixel or I2C libraries, and not spend time on implementing the driving logic yourself.
Hi again Arik,
Thank you very much for the speedy reply. I apologize for not having been more clear. Still, I think that with your explanation to study over, I would just have one follow-up question please.
To clarify, disregard the I2C reference. I should have known that by using a DATA_PIN and the FastLED or AdaFruit Neopixel library, any data streams to control the addressable LED strip is taken care of.
Sorry about that bit of confusion.
To simplify the question, I could accomplish the objective if I simply has a stream of frequency data from the FFT/FHT process. It’s easy for me to produce my lighting results with analog value streams but I simply don’t see where to “tap into” the FFT code to get my frequency data stream as I sweep up/down with the audio. I will go back over and study what you’ve kindly written to see if I can figure out the suggestion of using “serial output”. I Not being familiar with the output format of the FFT, or even how to access it,
My objective is almost identical with the effect shown here. It appears to me that this example shows a strip of “Neopixels” that is responding in the frequency domain in two ways. Color and position. My objective is color vs. frequency. If I could do that, the rest would follow. To be concise and clear, here is a great example (link at the end of this) of how I’d like to learn to use FFT/FHT. Sweeping from, say, 500 Hz to 5000 Hz, I would see color changes (and position mapping along the strip if desired). I can handle the mapping of the color & position if I could just break out the FFT output of frequency data. I just can’t seem to “connect the dots” (no pun intended) as to how to get a variable containing frequency data. (Maybe I need to study your “serial out” suggestion more in depth?)
I am sure that rigorous studying of your blog would lead to a better understanding as well. Just to wrap up my ramblings, here’s the YouTube video example showing the affect I seek. Thanks in advance and thank you for allowing me to presume upon your good graces. Believe me, it’s more appreciated than you could know. Best.
https://www.youtube.com/watch?v=-MGj_7GwX_Y
Hi Arik…
I read back through your articles on this subject and, combined with your last reply, found exactly what was needed.
So, thank you very much for your time and expertise. I continue to learn from your blog and it’s a tremendous resource in so many ways.
Best regards,
Bill
Hi Bill,
Happy to hear that. You are welcome to post a link here to your end result if you are going to make it public.
Thank you Arik. If I am successful, I would be happy to post it. The public is ALWAYS welcomed to anything they find useful.
Keep up your very fine and inspirational work.
Boa noite, antes tentei fazer o projeto com o lm393, mas como voce tinha falado ele não é amplificado, comprei um MAX4466, mas estou tendo dificuldades para calibrar, eu tenho que inserir algum valor no programa?
Me ajude, estou precisando finalizar esse projeto, mas não sou muito bom com arduino. muito obrigado pelo grande trabalho.
Good night, before I tried to do the project with the lm393, but as you said it is not amplified, I bought a MAX4466, but I’m having difficulty calibrating, do I have to insert some value in the program?
Help me, I need to finalize this project, but I’m not very good with Arduino. Thank you so much for the great work.
Hi Bill,
To perform calibration you first need to have working dB values which are relative to mic max. Does that work for you? Those are negative dB values.
Then measure the sound level with another calibrated device and add any difference between the measurements to your value to make both reading the same.
Hello, thank you very much for responding, on my lcd this with 0% and – 49 dB, I applied a frequency of 920Hz, through a mobile application 5cm away it varied to 6%, – 25dB, how to calibrate and change the values for a value close?
Hi Bill,
First, having the dBs increase when making a sound is a good sign.
When you are asking how to calibrate it you have to decide what to calibrate it with. I assume you want to calibrate it with a typical sound meter which is relative to the standard agreed sound pressure baseline value of 20 micropascals.
Take a standard sound meter and your Arduino sound meter. Measure some sound in similar conditions. If your meter measures the sound as -25dB and the standard one as 50dB then you need to add 75dB to your sound meter readings to make them reference the same baseline point.
thank you very much for the help Arik Yavilevich, I was able to put a constant to adjust the dBs, can adjust without setting this constant of adjustment ?. The dBs min is at +47 dB and I can not vary less than that in a low sound, have any suggestions to fix this. Thank you very much
Hi Bill,
Not sure what you are asking. Trying to guess that you might want to also “play” with your gain setting. If your min is 0% at the arduino device then you might want to increase the gain to have a value greater than 0%. Then re-calibrate.
Hi Arik,
Thanks for so nice article, im testing your code with my arduino UNO and a LM393 module connected to 3.3v and AREF as specified but the output values Im getting to messuring volume are pretty highs as following:
(low noise level – highl noise level)
Time: 53 Min: 29 Max: 35 Avg: 31 Span: 6, 4, 2
Time: 54 Min: 29 Max: 1023 Avg: 186 Span: 994, 837, 157
Time: 53 Amp: Max: 94% Avg: 93% RMS: 133% dB: -0.560
Time: 55 Amp: Max: 99% Avg: 92% RMS: 132% dB: -0.636
Ive also tried changing ampMax to 512 getting:
Time: 53 Amp: Max: 89% Avg: 87% RMS: 124% dB: -1.165
and 256:
Time: 54 Amp: Max: 78% Avg: 75% RMS: 107% dB: -2.485
What am I missing?
Thanks, Isaac
Hi Isaac,
Can you be more specific to what module you are using and how it is connected to the Uno?
The code in the article is specific to the MAX4466 and similar modules.
What you probably have is a sound detection module and not a module that provides a sound waveform. See module comparison section in the article above.
Specifically, based on your “low noise” “analog measure” printout, you can see that avg reading is 31 and not 512(=Vcc/2) as desired.
Hi Arik,
Thanks for this very thorough article. I am currently a high school senior doing a project that requires recognizing the frequency of sound and based on the frequencies to control a mini robotic car. But I ran into some problems running the MeasureFHT() method. I am using an Arduino UNO and a MAX9814 microphone for sound input.
Since I am not familiar with the “#” notation, I kind of ignored the error “warning: extra tokens at end of #ifndef directive” And I commented out the Serial.write() so I don’t get binary results. However, I got the same results, ranging about 20 to 80 and sometimes a huge number pops out regardless to the input. I suspected that the input was not even considered because when I disconnected the microphone it still gives the same results.
It would be great if you can help me sort out this problem.
Sincerely,
Elton Lin
Hi Elton,
1) Do note that the MAX9814 is an automatic gain module. So had to predict how it will behave for this purpose. Your values will be “normalized” but a value of X at one point might stand for a completely different sound volume at another point. This is because the module adjusts the gain constantly.
2) At what point did you get the “warning: extra tokens at end of #ifndef directive” error? Is this with the original code? What line is the error on?
3) If you commented out serial.write, how did you arrange for the output to be printed? Perhaps post your current code on pastebin and link here.
4) Did you do MeasureAnalog and MeasureVolume and found the results correct and as expected? If unsure, post those outputs too, for both quiet and sound cases.
Thanks for the quick reply!
2) the error points to the line #define use 3.3 and #ifndef Use 3.3, so I commented out the #define use 3.3 then both analog and volume seem to start working.
4) MeasureAnalog and MeasureVolume both seem working.
Volume max range from 50% to 100% and db -5.9 to -5.5
Analog:
quiet:
Time: 53 Min: 251 Max: 258 Avg: 254 Span: 7, 4, 3
Time: 54 Min: 250 Max: 259 Avg: 254 Span: 9, 5, 4
Time: 53 Min: 251 Max: 259 Avg: 254 Span: 8, 5, 3
Time: 53 Min: 250 Max: 260 Avg: 254 Span: 10, 6, 4
Time: 53 Min: 251 Max: 259 Avg: 254 Span: 8, 5, 3
Time: 54 Min: 251 Max: 258 Avg: 254 Span: 7, 4, 3
Time: 53 Min: 251 Max: 259 Avg: 254 Span: 8, 5, 3
Time: 53 Min: 251 Max: 260 Avg: 254 Span: 9, 6, 3
Time: 54 Min: 251 Max: 259 Avg: 254 Span: 8, 5, 3
me making loud noises:
Time: 53 Min: 194 Max: 315 Avg: 254 Span: 121, 61, 60
Time: 53 Min: 171 Max: 339 Avg: 254 Span: 168, 85, 83
Time: 53 Min: 105 Max: 409 Avg: 254 Span: 304, 155, 149
Time: 53 Min: 169 Max: 351 Avg: 254 Span: 182, 97, 85
Time: 53 Min: 174 Max: 353 Avg: 254 Span: 179, 99, 80
Time: 54 Min: 160 Max: 362 Avg: 252 Span: 202, 110, 92
Time: 53 Min: 149 Max: 364 Avg: 253 Span: 215, 111, 104
3) Modified code:
// calculate frequencies in the signal and print to serial
void MeasureFHT()
{
long t0 = micros();
#ifdef ADCFlow
//cli(); // UDRE interrupt slows this way down on arduino1.0
#endif
for (int i = 0; i < FHT_N; i++) { // save 256 samples
#ifdef ADCFlow
while (!(ADCSRA & /*0x10*/_BV(ADIF))); // wait for adc to be ready (ADIF)
sbi(ADCSRA, ADIF); // restart adc
byte m = ADCL; // fetch adc data
byte j = ADCH;
int k = ((int)j << 8) | m; // form into an int
#else
int k = analogRead(MicPin);
#endif
k -= 0x0200; // form into a signed int
k <<= 6; // form into a 16b signed int
k <<= FreqGainFactorBits;
fht_input[i] = k; // put real data into bins
}
#ifdef ADCFlow
//sei();
#endif
long dt = micros() – t0;
fht_window(); // window the data for better frequency response
fht_reorder(); // reorder the data before doing the fht
fht_run(); // process the data in the fht
#ifdef FreqLog
fht_mag_log();
#else
fht_mag_lin8(); // take the output of the fht
#endif
/*#ifdef FreqSerialBinary
// print as binary
Serial.write(255); // send a start byte
Serial.write(FreqOutData, FHT_N / 2); // send out the data
#else*/
// print as text
for (int i = 0; i < FHT_N / 2; i++)
{
Serial.println(FreqOutData[i]);
Serial.print(',');
}
long sample_rate = FHT_N * 1000000l / dt;
Serial.print(dt);
//Serial.print(',');
Serial.println(sample_rate);
delay(100);
//#endif
}
And the result:
,43
,16
,25
,27
,0
,0
,35
,16
,16
,43
Thanks a lot!
Hi Elton,
I can see that your MAX9814 module is “DC based” at 1.25V . You can see that in the Avg value of the MeasureAnalog function. For comparison, the MAX4466 (for which this code is written) is biased at Vcc/2 which will show 512 at the Avg value of MeasureAnalog when all is proper. The can be an issue for the current MeasureVolume implementation but shouldn’t be an issue for frequency analysis. If general sound level measurement is important to you then you will need to make modifications to the code to make it process your 1.25V biased signal correctly.
Other than that I see nothing wrong. I see you made changes to the serial printing code and I am not sure about your motivation for those changes.
The reason why you sometimes get a large value is because you are printing both FHT bin values and the sample rate to the serial channel mixed together.
Originally, the bins or each FHT invocation are printed in a single line followed by “dt” and the sample rate. You modified it to print each bin on a new line so it might look like a mess but in reality it is probably accurate.
I suggest you revert to the original code and then debug it by using a sound generator. Figure out how different sounds show up in the bin values of the FHT. Good luck.
Hi Arik,
Thanks for explaining that.
I tried again with the original code except I still had to comment out the #define use 3.3.
But the result shows a bunch of symbols which I assume is from the binary output:
⸮Ͽ:#O{⸮b1#(#& or ⸮Ͽolry⸮⸮⸮~{j\OGA5+.CAE)33?’!8!! contunuesly
And that’s the reason I commented out the binary output part. Then the ouput becomes the same thing I showed before :
9
,27
,0
,8
,24
,19
,30
I wonder what should the output be, should it be about the same as the frequency the sound it takes in or something else represents that particular frequency.
Thanks again, I really appreciate it!
Hi Elton,
The default in the code is binary output. This allows you to integrate out of the box with processing visualization (as described above).
The proper way to switch to textual output is to comment out “#define FreqSerialBinary” on line 29.
Spend some time to learn about https://en.wikipedia.org/wiki/C_preprocessor
The original code doesn’t put a new line between numbers of the same run. See lines 227, 288. So the output is not like you listed.
The output is one line per run. Each line contains FHT_N/2 bin values followed by dt and sample_rate values.
To understand how the bins work, read the FHT part in the article. It is all explained there.
Excellent job
Hello Arik,
Firstly, I’d like to thank you for this blog, helped even a beginner like me
to understand the workings.
Similar to Elton’s case, I had to comment out the
#define Use3.3to get the spectrum working.I would like to know whether it’s possible to get the exact frequency of sound played in serial monitor as TEXT. If so, then I was hoping you could point me in the right direction.
Regards,
Nirmal
Hi Nirmal,
It should be possible but you will need to implement it.
After each FHT, go over the bins and see which one has the highest value. Convert the index of the max bin to a frequency range based on the explanation above. Print the center of the range and there you go.
Hi Arik
Thanks very much for your blog.. it is very useful..
I have done every step that you explain..
I get the following values (I’m not using Arduino, I’m using a chip Cortex M4 64 MHz)
I have to adapted the code.
Could you check my first values?
Amp Max:22.46 AVG:20.46 RMS:149.73 DB:-13.77
Amp Max:21.67 AVG:18.67 RMS:136.69 DB:-14.56
Amp Max:21.48 AVG:18.71 RMS:136.98 DB:-14.55
Amp Max:21.28 AVG:18.68 RMS:136.75 DB:-14.56
Amp Max:21.28 AVG:18.67 RMS:136.66 DB:-14.57
Amp Max:21.28 AVG:18.65 RMS:136.57 DB:-14.57
Amp Max:20.89 AVG:18.63 RMS:136.37 DB:-14.58
Amp Max:21.48 AVG:18.63 RMS:136.40 DB:-14.58
Amp Max:20.89 AVG:18.63 RMS:136.36 DB:-14.58
Amp Max:20.70 AVG:18.60 RMS:136.16 DB:-14.60
Amp Max:21.09 AVG:18.65 RMS:136.48 DB:-14.58
Amp Max:102.53 AVG:29.91 RMS:284.57 DB:-8.19 /// HERE one CLAP !!!!
Amp Max:38.47 AVG:18.59 RMS:141.43 DB:-14.27
Amp Max:22.65 AVG:18.58 RMS:136.12 DB:-14.60
Amp Max:21.28 AVG:18.60 RMS:136.16 DB:-14.60
Amp Max:20.50 AVG:18.54 RMS:135.66 DB:-14.63
Amp Max:20.70 AVG:18.57 RMS:135.96 DB:-14.61
The time is approximately 20 millisecond for 2048 samples.
i’m using CJMCU-622 module (do you know it?), do you think it will help to get spectrum of the sound?
for me, it is very strange how the FHT works to divide the adc information in the spectrum zones..
the data directly from adc it is like the follow (in silent, and 10bit adc):
app: ,415,
app: ,413,
app: ,416,
app: ,412,
app: ,416,
app: ,416,
app: ,416,
app: ,415,
app: ,414,
app: ,416,
app: ,413,
app: ,415,
with talking person, no loud sound
app: ,390,
app: ,389,
app: ,392,
app: ,390,
app: ,391,
app: ,392,
app: ,391,
app: ,393,
app: ,390,
app: ,393,
app: ,392,
app: ,396,
app: ,397,
app: ,401,
app: ,400,
app: ,397,
app: ,399,
app: ,401,
app: ,402,
app: ,400,
well. each values is 20 millisecond / 2048 = 10 micro second
Thanks for your help..
Ricardo
Hi Ricardo,
I am not familiar with the CJMCU-622. Looks strange to me that “talking person” values are lower than “no sound” values.
Can you adopt MeasureAnalog function to your platform and post the results for both sound level cases?
Hi Arik
Thanks a lot for your answer… well I haven’t realized of when the increase the noise the adc value going down…
well.. here the data…
Quiet sound
Min:410.00 Max:425.00 Avg:416.73 Span:15.00 ,8.26 ,6.73
Min:409.00 Max:424.00 Avg:416.95 Span:15.00 ,7.04 ,7.95
Min:410.00 Max:425.00 Avg:416.27 Span:15.00 ,8.72 ,6.27
Min:409.00 Max:425.00 Avg:416.31 Span:16.00 ,8.68 ,7.31
Min:410.00 Max:426.00 Avg:416.82 Span:16.00 ,9.17 ,6.82
Min:409.00 Max:425.00 Avg:416.75 Span:16.00 ,8.24 ,7.75
Min:408.00 Max:423.00 Avg:416.22 Span:15.00 ,6.77 ,8.22
Min:409.00 Max:425.00 Avg:416.79 Span:16.00 ,8.20 ,7.79
Min:409.00 Max:425.00 Avg:416.70 Span:16.00 ,8.29 ,7.70
Loud sound
Min:338.00 Max:506.00 Avg:416.36 Span:168.00 ,89.63 ,78.36
Min:352.00 Max:481.00 Avg:415.88 Span:129.00 ,65.11 ,63.88
Min:347.00 Max:474.00 Avg:417.76 Span:127.00 ,56.23 ,70.76
Min:363.00 Max:457.00 Avg:418.14 Span: 94.00 ,38.85 ,55.14
Min:367.00 Max:457.00 Avg:417.44 Span: 90.00 ,39.55 ,50.44
Clap sound
Min:393.00 Max:444.00 Avg:422.72 Span:51.00 ,21.27 ,29.72
Min:393.00 Max:445.00 Avg:418.38 Span:52.00 ,26.61 ,25.38
Could it work to use for spectrum?… at the weekend im going to work in the FHT…
Thanks in advance..
Ricardo
Hi Ricardo,
You can see that the 0 offset for your mic/amp is at 416 ADC reading. This article and the accompanying code defaults to 512 (Vcc/2), so it wouldn’t work well in your case without modifications. Otherwise looks valid.
What does 416 ADC mean in terms of voltage? What should be the baseline of your mic/amp?
Your sampling rate of 100K samples per second should work well for sound processing.
Hi Arik
thanks for your comment about the mid value, the Vref isn’t correct.. now I have correct the reference.
What does 416 ADC mean in terms of voltage?
when I connected the adc to Vdd, the value was 817..
What should be the baseline of your mic/amp?
i have corrected the setting of vref and internal gain of the chip…
Quiet sound
Min:498.00 Max:526.00 Avg:511.82 Span:28.00 ,14.17 ,13.82
Min:495.00 Max:527.00 Avg:512.24 Span:32.00 ,14.75 ,17.24
Min:497.00 Max:528.00 Avg:512.20 Span:31.00 ,15.79 ,15.20
Min:499.00 Max:526.00 Avg:512.57 Span:27.00 ,13.42 ,13.57
Min:498.00 Max:528.00 Avg:512.32 Span:30.00 ,15.67 ,14.32
Loud sound
Min:229.00 Max:810.00 Avg:515.27 Span:581.00 ,294.72 ,286.27
Min:297.00 Max:709.00 Avg:513.87 Span:412.00 ,195.12 ,216.87
Min:365.00 Max:668.00 Avg:513.65 Span:303.00 ,154.34 ,148.65
Min:258.00 Max:724.00 Avg:512.57 Span:466.00 ,211.42 ,254.57
Min:209.00 Max:762.00 Avg:510.32 Span:553.00 ,251.67 ,301.32
I guess now should be ok..
I have taken a look the ARDUINOFHT…
I think the function wont work, the library has a lot link to other arduino libraries.
do you know another library in C code to easy implement?
Im using NRF5280 chip..
thanks for all your advice..
Ricardo.
Hi Ricardo,
Good results. Your “Avg” and “Span” values now mean perfect sense.
With regards to ARDUINOFHT, it is made for simple AVRs and might not work on a Cortex M4. The ARM is surely more powerful than the AVR so if anything, it should be easier to do FHT there.
I have not done signal processing on the ARM, but a quick search shows there are resources available. See: https://forum.pjrc.com/threads/28375-A-Fast-Hartley-Transform-for-the-Teensy-3-1
As always, if you find a library or code that works for you, please share here. Good luck.
Hi Arik…
Sorry for the delay… I have worked with the project… (I spend a lot of time)
Well I have good news.
YES. ARM has a very good library, called CMSIS DSP here the link (http://www.keil.com/pack/doc/CMSIS/DSP/html/group__ComplexFFT.html)
I used the same library but it is included in the SDK 15 of the nrf52840.
I had to solve some problems..
1.- Config the FFT function, and understand how to use it.
I copy the resume of the code… to other could be useful
#define Total_samples 128 // total measures reads from adc
int16_t vibdata[Total_samples],
Incomplex2[Total_samples*2],
fftvibout[Total_samples];
// take care incomplex2 needs double size of total samples...
arm_rfft_instance_q15 RealFFT_Instance;
void Function_calc( some thing)
{
arm_rfft_init_q15(&RealFFT_Instance,Total_samples,0,1);
arm_rfft_q15(&RealFFT_Instance,(q15_t *)vibdata,(q15_t *)Incomplex2);
//here calc the magnitude, the function arm_cmplx_mag_q15 or other doesnt work for me, I use the following FOR cycle.
for(e=0; e<Total_samples; e++)
{
fftvibout[e] = (int16_t)sqrt((Incomplex2[(2*e)+0])*(Incomplex2[(2*e)+0]) + (Incomplex2[(2*e)+1])*(Incomplex2[(2*e)+1]));
}
}
int main(void)
{
RealFFT_Instance.fftLenReal = Total_samples;
}
2.- Problem… I checked the data, using tones from youtube (5000 hz sound tones) for example. or a scale tones from 0 hz to 20 khz.. To check the result..
the problem was the curved bounce, in other words the peak is moving from left to right but in 6000 hz when the peak reaches the right edge it is returned, the solution is scan more fast..EASY (I have spent a lot of time in realize about it)…. that is why I use the ticker, I take a measure each 50 micro second…
Finally I have the synchronize the matrix with the frequency.
The speed of calc of the cortex M4 64Mhz is the following..
In general 12700 ADC per second (adc measure + FFT funtion)
For example:
If you have a buffer of 2048 measures.. you can get 6 curve per second (12700/2048 = 6) each curved of 1024 point.
If you have a buffer of 256 measures.. You can get 64 curve per second, each curves of 128 point.
I hope to be clear.. I have tested two buffer.. 4096 and 512.. I got 2048 and 256 point respectively.. with both point the data calc was aproximately 12700…
Thanks for all your advices..
Ricardo
Greetings from Chile.
Hello
I use FHT analyse sound and send a sine wave with 1khz but magnitud of it in 1 khz is not in range of amplitude first sin wave signal
I use sample rate 19200 and sample 256
I dont know where is problem?
I dont know what is relation between adc amplitude in first signal and magnitude of per frequency
If use a sine wave signal with constant amplituide when analiyze by fht,it must show magnitude equal to first signal
For example if we have a sine wave with frequency 1khz and amplitude ADC=300,fht must show maximum magnitude in 1 khz with magnitude near 300
Pingback: an Arduino based electronic stethoscope – In search of ______
Excuse me for my bad english …
I think there will always be an error in your results; from the beginning, for the formula “RMS” you consider that an acoustic wave is similar to a sinusoidal wave. However, it is not the case.
The ideal would be to use a true root mean square formula on several samples and in this way obtain a result with an fixed integration time as in real sound level meter.
Hi Fred,
Yes, RMS is an estimate. A lot of components in this build are not accurate. I consider a sound level meter on an ATmega328P to be in the “I can’t believe this even works” category rather than “this is a replacement for a real dedicated measurement tool/device” category.
You are welcome to improve the implementation though.
Hi Arik, how i do this project without LCD??can i use serial monitor in Rduino IDE?
Just don’t connect an LCD and remove any LCD lines in the code. The LCD doesn’t have any part in processing the sound it is just so the end device can be stand alone.
I believe there are already serial prints for all the interesting bits, but of course you can add more if you want.
wow thank for your fast respond arik…may i ask again brother??
so, what i have to do for the project is to upload your program to my arduino board right??using one of microphone module….is that right arik??or is the something else that i have to do ?? is your source code that you share in this blog ready for compile to arduino board arik??.
sorry for a long question arik…
Hi Zaki,
Yes, that is right.
If you don’t have any Arduino experience you should take some time first and do a few basic projects first.
Hallo again arik..i tried to compile and uploading the program arik, but it has an error:
Build options changed, rebuilding all
MAX4466_try.ino:7:40: fatal error: FHT.h: No such file or directory
compilation terminated.
Error compiling.
then i try to delete all FHT line coding in the program arik, but the output that i get is like this arik:
Time: 54 Amp: Max: 99% Avg: 99% RMS: 142% dB: -0.017
Time: 54 Amp: Max: 99% Avg: 99% RMS: 142% dB: -0.017
Time: 53 Amp: Max: 99% Avg: 99% RMS: 142% dB: -0.017
Time: 54 Amp: Max: 99% Avg: 99% RMS: 142% dB: -0.017
Time: 54 Amp: Max: 99% Avg: 99% RMS: 142% dB: -0.017
Time: 53 Amp: Max: 99% Avg: 99% RMS: 142% dB: -0.017
please help me arik…
Hi Zaki, FHT is the library that you need to do frequency analysis. If you don’t need that you can remove that part of the project.
sorry arik…i am wrong doing this project…i did not connect 3.3v vcc to AREF in arduino UNO…then i connect this pin, and i get this result:
if the room silent
Time: 53 Amp: Max: 4% Avg: 0% RMS: 1% dB: -37.110
Time: 55 Amp: Max: 6% Avg: 1% RMS: 2% dB: -34.273
Time: 53 Amp: Max: 7% Avg: 2% RMS: 4% dB: -30.587
Time: 54 Amp: Max: 4% Avg: 1% RMS: 2% dB: -34.790
Time: 53 Amp: Max: 21% Avg: 4% RMS: 8% dB: -24.835
Time: 55 Amp: Max: 22% Avg: 4% RMS: 9% dB: -23.526
Time: 53 Amp: Max: 13% Avg: 1% RMS: 4% dB: -31.047
If i speak
Time: 53 Amp: Max: 100% Avg: 86% RMS: 130% dB: -0.790
Time: 54 Amp: Max: 100% Avg: 94% RMS: 137% dB: -0.350
Time: 54 Amp: Max: 100% Avg: 76% RMS: 119% dB: -1.585
Time: 54 Amp: Max: 100% Avg: 29% RMS: 52% dB: -8.753
is that a normal value arik??and why i get minus dB value arik, and can i change it to positive value?
thanks arik…
Hi Zaki,
Results seem fine.
What dB value did you expect?
The code calculates dB value relative to dB=0 for max sound that your device can capture. You can move the values to a positive range simply be adding some numeric value to the result. For example, add 50dB and you will have positive values.
Read more about calibration in the comments and article above.
halo arik…thanks for answering all my question arik…arik, how if i expect the sensor value between 0dB-80dB arik?and can i get an average of dB value?
for example arik, i want average of dB value for every 30 seconds??should i calculate it manual arik?((t1+t2…+t30)/30)) or are there an easier method arik??
thanks arik…
Hi, a regular average seems simple enough.
what coding we use to get an average of sensor value every 30seconds arik??is there any reference arik??
thanks arik
You can use something like this https://playground.arduino.cc/main/average
If you search “Arduino average” you will find a lot of examples.
Thank you so much arik.. i will try this
halo again arik…arik, which coding line i have to change if i want to get positive value form sensor value arik?(i get sensor value between-2dB-(-36dB)..
how if i want to get a sensor value in range 20dB-70dB arik??
thank you arik
It will not be possible to reach a dB range of 50dB with a 10bit ADC used in this setup. A range of ~35dB is what you can expect to get.
To shift the range to positive values use something like
float dB = 20.0*log10(soundVolRMSflt/AmpMax) + 50;
instead of just
float dB = 20.0*log10(soundVolRMSflt/AmpMax);
thanks arik…if it is not possible for me to get that range, is it possible to callibrate sensorvalue with desibell meter that i used in my smartphone arik?
thanks you for answering my long question arik,
yes, this is explained in the comments above.
i already tried to get average of sensor value for 30 seconds arik, but it did not work,,can you help me arik??
thanks arik,
Hey, unfortunately discussion of general programming issues would be off-topic for this post. A better place for that would be https://arduino.stackexchange.com/ and https://forum.arduino.cc/
Hello Arik, congratulations for the project. I’m new so I do not have much experience. I would like to obtain only the value of decibels to later establish a certain value and be able to reproduce an alarm by voice through a speaker when that value has been exceeded.
For now what I need to know is the measurement of the decibels.
Thank you very much, I hope you can help me.
I am at the initial phase of using your code.
Setup:
Max 4466 – 3.3V supply voltage
Vref (Uno) – 3.3V
No changes to the code.
Serial monitor: 9600
I have been trying the function:
void loop(){
// what do we want to do?
//MeasureAnalog();
//MeasureVolume();
MeasureFHT();
}
But the function MeasureFHT(); does not work – the serial monitor show something like when the baud rate is wrong.
(The funtions MeasureAnalog() and MeasureVolume() works fine)
What have I done wrong?
Hi Frede,
By default `FreqSerialBinary` is set and the code is meant to be used with a processing visualizer. Read the section about the “FHT 128 channel analyser” above.
If you want a textual serial output, undefine `FreqSerialBinary`.
Hi Arik,
Thank you very much for the fast reply. I understand.
I will continue and I am looking forward to set up the complete application.
Hi Arik.
This project “sounds” interesting (sorry had to do it). I have been playing with Arduino for a couple of years now and also have been wanting to do sound analyzing on my bee hives just for personal research/playing around. I am curious in learning if I can detect when there is an intruder in the hive by the elevation of the hive sound along with other unknown findings with sound (like death of the queen, poor health/good health, hive temp = vibration from wings heating or cooling the hive, etc). I already own two of the microphone devices that you spoke of, HXJ-17 / Keyes module and Sound detection module. Would either one be better for my project (I’m thinking HXJ-17)? Do you have any suggestions or tips that you could give?
Hey Drew,
Nice project idea.
As mentioned it he article, the two devices that you have lack an analog output and/or an amplifier. So they would not be useful what you are trying to do. You would be better with a device like Max 4466 or something more advanced.
Yes, I misunderstood that part about the analog output, makes sense! Thank you.
Hello Arik,
What a wonderful article !! loved reading it. I am a beginner to sound related project, but I need to work on a project, where I need to detect abnormal noise on a running machine. Based on the complexity of sound wave & pressure theory, please suggest if using max 4466 with arduino is capable for the job or not. In normal operation the machine would generate a sound level of 100 dB, while when the abnormality is there, the sound level goes as high as 115 db.
Can you please help with the sketch which specifically works for this dB range accurately using max 4466.
Regards
Haritesh
Hi Haritesh,
Yes, should work. You would have to test and experiment with different settings.
The sketch is already published in the article and it is not specific to one dB range.
Hi Arik,
Just wanted to thank you for the amazing blog post. Very informative ! I’m working on a project to make a portable arduino spectrum analyzer with and LED mapping display (for a costume) and this is a game changer for sure ! 🙂
Thanks again
Hey Antoine,
Happy to hear that. Have fun with the costume!
Sir can how can we use an Arduino board circuit to get vibrational signals
Hai again Arik…thank you for alway answers my questions arik…this is really helpful for my project arik…i found something new in this project arik…when i uploaded my program, i got a range value between 20dB and 50dB(highest)…but when i used a long jumper in my circuit, i got a range value between 9dB and 50dB(highest)…the long jumper in my circuit extend my range value!!…i dont know why,,,do you know something about this arik??
Thank you
Hi Zaki,
This is interesting. I assume that when you mean “long jumper” you refer to a longer wire between components? Which components are farther apart now?
The lower limit is determined by how quiet the input is. That could be because the microphone is now farther from a sound source but it can also be electrical. The system has electrical interference and that adds some randomness to the signal. When this “noise” is strong the wave is farther from 0 signal and the dB is higher. Perhaps you changed something and that decreased the amount of electrical noise in your system.
i have a new reason arik…it is not because long jumper…
first, when i uploading the program to arduino, i get a range value between 15dB and 48dB…
But, when i add a relay in my components, i get a range value between 37dB and 48dB
why this happen arik??i dont know arik…i already try to fix it, but i still get this range value if i add a relay (37dB and 48dB)
please help me arik…thank you..
i just add this in the program arik…
pinMode(relay1,OUTPUT);
digitalWrite(relay1,LOW);
and i get range value between 37dB and 48dB
i dont know why this happening arik..
Hi Zaki,
My guess is that the relay adds noise and influences the microphone.
Try to put them far from each other. You might want to talk to an electrical engineer about this issue.
thank for your answer arik….
and i maybe have found a way to extend a range value…if i change this coding
float dB = 20.0*log10(soundVolRMSflt/AmpMax)+50;
with this coding…
float dB = 40.0*log10(soundVolRMSflt/AmpMax)+50;
i extend range value from 30dB and 48dB to 18dB and 48dB!!!!!,.,,,
but is this okay arik???
thank you my friend…
if you change 20 to another number then the result is no longer dB.
https://en.wikipedia.org/wiki/Decibel#Acoustics
but, if i calibrate the new value with desibell meter…will it work arik??
Hi Arik, congratulations for the project, I have been working with sound tranformation into decibel on arduino and trying to do FFT (FHT also).
For the lack of range I went to the STM32 and MEMS microphone digital word and got a way better output response and range.
On my main project I could check the calibration at 94dbA @1Khz and at 114dBA @1Khz with a 0.1 dbA error. We can talk about this later if you’re interested.
Back to you project, I’ve done it and I could achieve the -45dB when the microphone is with low noise. With the calibrator at 94dBA I could get an answer -26dB, when I change to the 114dBA on the calibrator, that changes to -6dB.
This 20dB difference brings me to believe that the code is working for high sound levels, as these microphones lacks of low amplitude sound sensitivity, it becomes harder to know how good the code would response in low amplitude sound.
I’ve used the the red analog sound sensor which has a LM393 ampOp dual comparator chip, the datasheet tells to supply 5V, but as you’re willing to work on the 3.3v range I think still works well.
I was able to see and test the spectrum analyzer, but I’m struggling to get the module (amplitude) of each bin, would you give me a way to access that information? What I want to do is to plot that information in excel or ever save in a database to display graphs of most commons frequencies, etc. Basically I want to study the frequency cross checked with different sound amplitude.
Congrats one more time! As soon as I tweak a bit more I’ll keep you posted of my findings related to frequencies.
Hi Diego,
Thanks for sharing the details of your progress.
With regards to your new setup, what did you use as a MEMS microphone? An off the shelf module or did you build it yourself? Can you post links or schematic? What about costs?
With regards to the calibration. It actually looks good. Note there are some differences between dB and dBA (weighted).
sample 1: vs standard sound pressure baseline (sspb): 114dBA, vs arduino max: -6dBA.
sample 2: vs sspb: 94dBA, vs arduino max: -26dB
So calibration offset is 120dB.
Then for sample 3: vs arduino max: -45dB => calculated value vs sspb: 120-45 = 75dB
So I see your point about low levels. The dB for low noise is too high. Check span of the analog signal. PErhaps you have too much electrical noise (interference). Are you using 3.3V? How stable is the power supply? What are you using for gain?
With regards to analyzing the spectrum, just run MeasureFHT. The results are in FreqOutData.
https://github.com/ayavilevich/ArduinoSoundLevelMeter/blob/master/ArduinoSoundLevelMeter.ino#L185
https://github.com/ayavilevich/ArduinoSoundLevelMeter/blob/master/ArduinoSoundLevelMeter.ino#L227
Regards
Hi Arik, I used a ICS43434 which you can find on Tindie, it has a I2S audio protocol communication, internal amplifier and filter, gives the outuput in digital format already, avoiding any interference, it’s off the shelf, around 11 dollars + shipping.
Yes I know the difference between dB and dBA, I actually implemented the A-Weight filter on my new project, but it seems to complicated to implement it on Arduino. Regarding the measurements, the maximum dB I got with your setup is -54dB, which make senses by the ADC with 10bits on Atmega328. The microphone I’m currently using, is a ready to go board, which comes with the amplifier already. It has two signals A0 and D0, I’m using A0, with 3.3V on the module, and also 3.3v on the AREF pin of the Arduino. Regarding the power suplly, I have an Arduino Nano shield witch I suplly with 9v 2A, and it gives me a stable 3.3v.
I’m not using any gain, I think on the code there is a gain but I haven’t touched it.
Running MeasureFHT, and the Processing code, I could plot the spectrum and see the different answer regarding to the output I’m generating with my phone, it really goes up to 20khz, really interesting. Now I’ll try to get the module of each bin so I could save that information for further analysis.
I’ll keep you posted whenever it work, thanks for your explanation, I’ll try the modules if I have any problem I’ll come back to you!
Later on I’ll try to apply some machine learning to understand the noises pattern around the sensor. When it occurs more, etc.
I’ll also need, Leq, Mean Average, Max, Min and other values that would be interesting to save.
Regards!
Hi Diego,
You are right. With a 10but ADC you can only go as low as -54dB.
This is calculated as:
20*log10(1/512) ~= -54
Where 512 = 2^10/2
However this is the range relative to arduino max, so by changing the gain on the chip one can shift the range from loud sounds to quiet sounds and vice versa.
Regards.
When you say change the gain on the chip, you mean on the sound module? On mine I have a Pot where I turn to try to achieve the sensitivy desirable, maybe changing the gain on the software that might work.
The gain in code “VolumeGainFactorBits” will gain the quantized values, so effectively it just decreases ADC bits. Not useful.
https://github.com/ayavilevich/ArduinoSoundLevelMeter/blob/master/ArduinoSoundLevelMeter.ino#L31
Any gain in the ADC will likely break stuff because the baseline of the module (the one I am using) is Vcc/2.
So the only gain relevant here is the gain on the module. I believe if you increase gain in the module your effective [-54dB, 0dB] uncalibrated range will move to lower calibrated dB values. So you will not be able to measure 110dB (relative to standard sound pressure baseline) but you will be able to do 30dB to 80dB for example.
If you have a chip with a I2C output it changes things. Perhaps there is way to control internal gain of that IC.
The purple microphone module mentioned above can only measure sound level (db), not frequency (Hz). How can code turn volume input into frequency output?
Hi Garmisch,
The module itself doesn’t measure sound level nor frequency. The module only converts the amplitude of the sound wave to an electric signal. An algorithm is needed in both cases to calculate the derivatives.
How does one convert a waveform in the time domain into values in the frequency domain? Most common way is using https://en.wikipedia.org/wiki/Discrete_Fourier_transform .
ah i got it, so this module didn’t measure any sound level nor freq,
but only electrical signal,
than the signal convert to be sound level and freq using algorithm,
to convert be sound level is using the code above,
and to convert be freq is using DFT algorithm that u didn’t use on code above?
am i right?
please explain more sir,
thanks
hello sir,
is this sensor detect for sound intensity and frequencies?
and also about the range of intensity and freq,
i still confused how to use this sensor sir,
need ur help,
tyvm,
Why are we selecting the number of samples as (1024*2)?
Tania,
We could select another number. This is just my choice that is not too small (so we get a good sample) but also not too large (so we don’t overflow sum variables, etc).
Specifically in this case, at around 40Khz sample rate this means about 50ms of worth of sample data.
Feel free to change to to a different value if needed.
Hi arik,
i’ve try your code and was success for measure analog and volume,
but i don’t know why the output in serial monitor for measure FHT
i got something like this
9%0#5#&%7&-
can’t read the data just like measure analog and volume
Hafizh,
The default is binary output designed to be consumed by the reader implemented if processing (all described above).
If you want textual output, undefine “FreqSerialBinary”.
each loop i got this many data
133,117,60,56,51,39,44,0,51,56,55,37,49,45,51,38,30,35,39,30,37,33,32,19,24,38,33,16,39,27,30,37,19,19,46,33,48,48,40,19,19,30,35,45,35,0,27,35,0,0,33,16,55,54,19,35,19,8,33,8,0,33,24,16,16,16,16,25,24,33,0,27,19,32,19,8,8,24,27,0,19,16,27,39,24,27,16,19,19,19,24,0,33,27,43,25,25,0,30,8,19,16,33,8,16,0,16,30,25,30,33,43,48,45,35,38,35,33,30,30,8,19,0,19,0,8,19,19,6616,38694
but in programs just for print FreqOutData in array
and dt, with sample rate this last 2 value (6616,38694)
another is FreqOutData,
what is the different of FreqOutData, dt, and sample rate Arik?
why so many FreqOutData in a time?
hi arik,
i try to use 2 sensor in my project with your code,
but when i try why can’t read another analog pin?
only A0 as max4466 pin that can read value,
but when i mark your set up as comment
another sernsor can read data,
my point is, how your setup work?
why can’t add another sensor to read data on another analog pin?
Hello Arik,
Thank you for your explanation. I was also wondering how the dB range varies with change in VolumeGainFactorBits? I thought it was only meant to increase sensitivity?
Hi,
I tried Your source from GITHUB
https://github.com/ayavilevich/ArduinoSoundLevelMeter
On Serial Plotter I saw graph with red and green lines only.
I used ARDUINO UNO and microphon MAX4466 based module on A0.
When I tried some sound there where no changes.
Graph is the same as without sounds.
Red level between 50-60.
If You send me mail I can send You PrntScr.
Please do You know what is wrong?
Many thanks for help.
Have a nice day.
Jiri
Hi Jiri,
The code on github makes no effort to work with the Serial Plotter. Have you made any adjustments to make them work together?
I suggest you post your code (if you made changes) and your screenshots here using pastebin and imgur.
Usually the first step is to see the output of MeasureAnalog() on the serial monitor to understand if your incoming data makes sense. See comments about that above.
Hi Arik
With an Arduino Mega Mini (https://www.aliexpress.com/item/32802420999.html)
I’m using your code at default except for removing the LCD code.
I’m using a MAX9814 so it has auto gain.
I am powering the audio module with 3.3 and 3.3 is tied to Aref.
Then only GND -> GND and data out -> A0.
I seem to have the max value stuck at 765 when checking the analog values
This is background room noise levels:
Time: 53 Min: 344 Max: 426 Avg: 386 Span: 82, 40, 42
Time: 54 Min: 326 Max: 435 Avg: 379 Span: 109, 56, 53
Time: 53 Min: 354 Max: 415 Avg: 383 Span: 61, 32, 29
Time: 53 Min: 305 Max: 471 Avg: 381 Span: 166, 90, 76
This is yelling or blowing or very loud input directly into mic:
Time: 54 Min: 0 Max: 764 Avg: 387 Span: 764, 377, 387
Time: 53 Min: 0 Max: 764 Avg: 406 Span: 764, 358, 406
Time: 53 Min: 0 Max: 764 Avg: 415 Span: 764, 349, 415
Time: 54 Min: 0 Max: 764 Avg: 406 Span: 764, 358, 406
I know this audio module says it’s dc offset is 1.25v
The gain floats 40, 50 or 60 but I don’t need absolute values, i’m looking for a non precise but still realistic frequency display.
The max value seems to be stuck at 765 ?
Do I need to adjust something for the DC offset?
(disabling ADCFlow or ADCReClock produce identical values)
The output also looks kind of realistic under fht output but very noisy and not very distinct:
background: https://pasteboard.co/IFcPeKP.png
loud noise: https://pasteboard.co/IFcPHbib.png
A frequency sweep will work too but with a very poor SN.
Also I intend to reduce the output to 12 channels (bins?)
Would you recommend performing the fht on 32 data points and discarding the first two as they seem always noisy or performing the fht on 256/128/64 and then averaging the results?
It confuses me a bit but here are my “Volume” tests:
background only (quiet):
Time: 229 Amp: Max: 33% Avg: 25% RMS: 36% dB: -11.829
Time: 230 Amp: Max: 33% Avg: 25% RMS: 36% dB: -11.791
Time: 229 Amp: Max: 35% Avg: 25% RMS: 36% dB: -11.804
Time: 230 Amp: Max: 36% Avg: 25% RMS: 36% dB: -11.806
Time: 229 Amp: Max: 34% Avg: 25% RMS: 36% dB: -11.797
Time: 229 Amp: Max: 48% Avg: 25% RMS: 36% dB: -11.742
Time: 230 Amp: Max: 38% Avg: 25% RMS: 36% dB: -11.761
Loudest possible:
Time: 230 Amp: Max: 100% Avg: 38% RMS: 65% dB: -6.743
Time: 231 Amp: Max: 100% Avg: 74% RMS: 113% dB: -2.028
Time: 230 Amp: Max: 100% Avg: 66% RMS: 103% dB: -2.783
Time: 231 Amp: Max: 100% Avg: 71% RMS: 109% dB: -2.339
Time: 230 Amp: Max: 100% Avg: 71% RMS: 109% dB: -2.321
Time: 231 Amp: Max: 100% Avg: 70% RMS: 107% dB: -2.468
Time: 230 Amp: Max: 100% Avg: 71% RMS: 109% dB: -2.314
Time: 230 Amp: Max: 100% Avg: 71% RMS: 108% dB: -2.360
Time: 231 Amp: Max: 100% Avg: 66% RMS: 102% dB: -2.867
That’s using slow mode. using free flow it takes about Time: 53 but gives the same volumes.
Hi Nick,
The sample was not written for the MAX9814 but for the MAX4466 which has a dc offset of vcc/2. So you will need to update the sample to use 1.25V as your offset. That would be around 387 in ADC units
The sample assumes that offset == max amplitude and that offset==512. So change here:
https://github.com/ayavilevich/ArduinoSoundLevelMeter/blob/master/ArduinoSoundLevelMeter.ino#L151
and here
https://github.com/ayavilevich/ArduinoSoundLevelMeter/blob/master/ArduinoSoundLevelMeter.ino#L201
The max is stuck at 765 because that is 1.25V*2 which is the max value you can get from this module.
Having said that, fixing the dc offset will only affect the first bin in the FHT, so it is not likely to affect the overall accuracy of the result. Try it though. The first bin is the DC offset basically.
Hi Arik
You have put me on the right track, instead of changing the code I have changed my AREF.
Instead of the 3.3v line I’m using a 10K resistor between 3.3v and AREF, this sets AREF at about 2.5v (AREF has 32K impedance.)
This is the analog output now:
Loudest noise:
Time: 54 Min: 0 Max: 1011 Avg: 540 Span: 1011, 471, 540
Time: 53 Min: 0 Max: 1011 Avg: 537 Span: 1011, 474, 537
Time: 53 Min: 0 Max: 1011 Avg: 537 Span: 1011, 474, 537
Time: 54 Min: 0 Max: 1011 Avg: 537 Span: 1011, 474, 537
Quiet Room:
Time: 54 Min: 476 Max: 543 Avg: 508 Span: 67, 35, 32
Time: 53 Min: 492 Max: 525 Avg: 504 Span: 33, 21, 12
Time: 53 Min: 470 Max: 529 Avg: 503 Span: 59, 26, 33
Time: 53 Min: 489 Max: 539 Avg: 509 Span: 50, 30, 20
A much better spread 🙂 🙂
Thanks
Hi Nick,
Thanks for the interesting update. Good thinking with changing the AREF, though I am not sure how it works in series. I would have used a voltage divider.
Results look much better now. Still, it is starange than the dc offset goes from 508 to 537 when the overall volume is louder. This is confusing to me. It should have stayed in the same place. Perhaps the module is not very accurate.
I am now using the internal 2.56v reference in the Arduino Mega.
Like this –> ADMUX = (3<<REFS0);
This reduces my total range from about 1011 to 980 but seems more stable.
The average still moves by maybe -5 +10 but can this be an uneven sine wave from the sound?
(I'm just using my voice to test not a pure tone 🙂 )
Anyway this is more than adequate for a simple spectral display, the display is just a fun visualiser option for what is primarily a Tetris/Breakout/Snake WS2812b display of 12×20.
Quiet: (Quiet PC in same room)
Time: 53 Min: 485 Max: 497 Avg: 490 Span: 12, 7, 5
Time: 54 Min: 484 Max: 497 Avg: 490 Span: 13, 7, 6
Time: 53 Min: 485 Max: 497 Avg: 490 Span: 12, 7, 5
Loud:
Time: 53 Min: 0 Max: 981 Avg: 489 Span: 981, 492, 489
Time: 53 Min: 0 Max: 981 Avg: 494 Span: 981, 487, 494
Time: 53 Min: 0 Max: 982 Avg: 491 Span: 982, 491, 491
Time: 54 Min: 0 Max: 982 Avg: 484 Span: 982, 498, 484
Time: 53 Min: 0 Max: 981 Avg: 486 Span: 981, 495, 486
Time: 53 Min: 0 Max: 981 Avg: 498 Span: 981, 483, 498
Time: 54 Min: 0 Max: 981 Avg: 497 Span: 981, 484, 497
Time: 53 Min: 0 Max: 982 Avg: 496 Span: 982, 486, 496
Time: 53 Min: 0 Max: 982 Avg: 488 Span: 982, 494, 488
There is still a fair bit of "noise" but I think for my purposes I will ignore this in code or consider a band pass filter. I wonder if I am seeing aliasing?
Thanks again Arik
Hey Nick,
Thanks for the update.
I am not sure what causes this. Probably some inaccuracies in the hardware module. But it doesn’t seem to be a big deal. Should have little effect on the spectral display.
You should not be seeing aliasing if you are sampling fast enough. Are you sampling at 38Khz? Try higher or lower just to test this theory.
Hello Arik,
The blog is really helpful Thank you for this.
It will be great if you can guide me,
I am trying to get frequency value of sound using db values in short i want to make a frequency meter using adafruit microphone, of the range 20hz to 800 hz and i’ll be using it in noisy environment So, how reliable you think the product or result can be? and How can i change db to Hz? I tried using FFT but all i am getting is same value irrespective of input at mic. Can I use your program code lines?
Thank you in advance
Regards,
Shruti
Hi Shruti,
You don’t measure sound volume in Hz. You measure it in db. So it doesn’t make sense to “change db to Hz”. The frequency range allows you to look at only “some of the sound”, i.e. a specific range. Please read the article again to get some concepts in order.
What output are you expecting to get from the code?
You can use the code I posted on github. Should give good results.
Thank you for your response.
I know that sound is measured in db but I am willing to get the frequency out of it. I want to use it is for designing acoustic belt tension meter. It will be great if you can suggest any ways and ideas to get the frequency of belt using acoustic method?
Regards
Nice try, but the requirements for a halfway usable SPL are much higher, than what an Arduino can provide:
The DAC of an arduino will sample an input signal with 10 bit.
That means +-512 discrete values.
That will give you roughly a dynamic range of only 16-20 dB at a *very optimistic* evaluation. Already at -10dB from the max, you have only 5 steps left to perform your analysis… That is not usable.
Real SPL (even the cheap ones!) are working with fast-switching variable gain amplifiers to be able to process a dynamic range of about 60db which means a signal ratio of 1 to 1 000 000.
The better ones at (1000K$ ++) can achieve 80dB dynamic.
Hi RIN67630,
The ADC of the basic Arduino boards does limit the range. This article is not intended to instruct you to build a commercial SPL but to build one with an Arduino. In the end you get a working SPL (with a limited range) and a useful spectrum analyzer. The principles explained in this article can be used to build an SPL with a larger range by using a different micro controller with a better ADC.
Hi, thank you for such a good article, I have a project where I have to measure following properties of noise in a room. 1) dB 2) Frequencies 3) Pitch 4) Tone. I am using ESP32 with a mems I2S microphone module, I was able to detect dB level but not sure how to get the other properties. any help would be greatly appreciated. thanks
Hello Arik,
Thank you for your very informative article! I am interested in implementing your design in a project to measure the resonant frequencies of several household items.
My question is as follows: if the Arduino ADC can measure values from 0-3.3V, how does your design handle the negative voltage values that one would encounter with a perfect sine-wave signal?
Or does your microphone have a DC bias that would prevent the output signal from taking negative values?
Thanks,
Andrew
Hi Andrew,
Yes. The MAX4466 module I used has a DC bias of Vcc/2. See “Implementation” section.
p.s. Arduino ADC can measure values between 0 and Varef. I have used Varef=3.3V just because it was stable. You can use another value.
Hi Arik,
I am using the MAX4466 and ESP32 for a integrated “state detection” module for industrial machinery connected to the internet.
Your tutorial helped me troubleshoot my approach to my implementation and at the same time refresh and learn some concepts that I haven’t used in some years now.
Thank you for the excellent work and dedication,
Wish you well.
Hi Ivan, thanks.
Sounds like an interesting project.
Hello Arik,
Thx for a good intro into the topic.
so where in Processing do I call settings()?
In setup()?
I don’t think you call it yourself. I believe Processing will call it on its own.
I have not used Processing in a while. You would be better asking this in a Processing related community site or seeing Processing documentation.
Hi Arik,
So far, your work has been invaluable for me, thanks for the detailed tutorial!
I’m measuring the pitch of a whistling kettle (using MAX4466 + Arduino UNO) and trying to building a PID controller to operate a gas burner so the whole system settles around a particular pitch (set point). Where should I begin in order to discriminate and isolate particular bins of data? Do you have an idea about the output’s data structure coming out from the FHT measure?
I wish you the best,
Martín.
Hi Martín,
Glad you found the article useful.
I suggest that for start just find the bin with the highest value. Map the bin index to the frequency and map the frequency to a note.
With regards to the structure of output, it is described above in section “Frequency analysis with FHT”.
Hi again Arik!
I could finally tame the data bins and managed to obtain some sort of dominant frequency out of a complex but steady sound (the kettle’s whistle), by averaging the peaks and smoothing the rate of change.
I’m sorry to write you again, but I’m having a hard time getting the Arduino Uno board to move a stepper while, at the same time, it performs the FHT measurement. Could this be related to the nature of the FHT measurement, i. e., that it’s too heavy on the controller? I can’t get the stepper to move, even when I comment all the measurement functions. Is it possible there are settings or something in the setup interfering?
Thank you very much for your worthy time !
Best wishes,
Martin.
Hi Martín,
Glad to hear you were able to identify the frequency.
An Uno board has an MCU with just one core and it can’t really multi task. While you are doing FHT nothing else will run except perhaps interrupts. This is core to how Arduino works and you can find a lot of material about it online. There are different ways to solve this but first you need to understand what does it require to move the stepper? Can’t you move the stepper between FHT calls? An easy solution might be to have another connected controller or IC to control the motor based on commands you send it from the controller that does the algorithmic.
Hi, you have your FHT data graphed as a 3D scatter plot, but the code you provide outputs a csv with several hundred columns. I think I must be missing something, but how are you graphing this in 3D? Have you reduced it to 3 columns at some point?
Actually I managed to get the Processing library working somehow (it wasn’t working before), but now that I can watch the frequency live, it appears there’s a lot of noise, even when there is no sound in the room. Is there any way to clean this up? I’m running using the AREF pin so it should be cleaner power, but not sure what else I could do to clean up the signal.
Hi Tyler,
It is not a 3D scatter plot. It is a 3D mesh. Fully populated dataset, not sparse.
Columns is one of the axes. In Excel look for graph types in the “Surface” category.
Yeah I had tried those, they all required only 3 columns. I must be doing something wrong. Anyway, I got the Processing library to actually work, so that’s much nicer, I’m guessing you didn’t see my other comment because I replied to myself. Here’s the relevant part of my comment:
> but now that I can watch the frequency live, it appears there’s a lot of noise, even when there is no sound in the room. Is there any way to clean this up? I’m running using the AREF pin so it should be cleaner power, but not sure what else I could do to clean up the signal.
I’ve tried changing the gain around, but if it’s too low, nothing is picked up, too high it’s crazy noisy, switching the fht algorithm just seems to change how high the peaks are.
Regarding noise, hard to say without troubleshooting your project. You should always expect some noise. Noise might not be a problem for some tasks, it depends on what you are trying to achieve. Try to compare what you get to the data I show above in the article.
Assuming there are no “bugs” in your circuit, you can reduce noise by using better components such as a better microphone or a better ADC, etc.
Hi Arik,
good job!
I wanted to ask you,
with your sketch it is possible to calculate
the distortion in percentage of each bin?
thanks for your advice, Angelo.
Angelo, maybe. How do you define the “distortion in percentage of each bin”?
Hi Arik,
I would like to measure the FFT of the mains voltage then
of a signal from 50hz to 350hz, 7 harmonics.
where each bin is 50hz.
I guess the magnitude can translate into a percentage
referring to the first harmonic of a perfectly sinusoidal signal.
by distortion I meant this,
thank you!
Angelo, the code above samples the signal at 38Khz, which is a good choice for audio. If you want to sample lower frequencies (i.e. 350hz) you would be better to adjust the sampling speed. I believe that with some adjustments you could successfully measure frequencies between 0 and 350hz with a similar setup. Provided of course you can safely convert main voltage to the 0-3.3V (or 0-5V) used by the Uno ADC.
thank you!
Hi Arik,
Thanks for this wonderful post. I was able to reference your implementation to do fourier analysis of guitar strings to determine the standing wave speed on the string.
It didn’t work too great, I think my MAX4466 wasn’t very good at picking up the sounds from the strings, and that strange noise in the low end of the transform made distinguishing low notes difficult. But it worked well enough on three of the strings to get a decent result!
I think any improvements on my experiment would need to directly analyze the signal from my guitar amp rather than use a mic, and maybe would need something with a bit more processing power for a higher resolution fourier transform.
Either way, I really enjoyed working on this experiment, and your work was critical for helping me unlock the arduino’s full potential.
Thanks,
Alex
Hey Alex,
That is cool.
Which frequencies did you measure, which were ok and which were bad?
If you don’t need the higher frequencies then maybe you can drop the sample rate to increase fourier resolution.
I have processed sound from a “line-in” in another project for a customer so it is definitely possible as well.
Regards,
Arik.
All strings on a guitar and their second and third harmonics. The only strings I was able to detect all three for were A, G, and high E (E4). Some of the other frequencies simply did not show up. I already had put the ADC divisor on 128, which as far as I’m aware is the maximum for the Uno. I’d love to develop it more but my presentation on it is today!
Hello
I use fht and anlysis the sound by max4466 and arduino uno , i want to convert magnitude to dB and show in each frequency how musch is sound level
How can i do it?
And another question i clibrate fht by soundlevel meter when the sound is 94 dB the magnitude is 2450 and maximum manitude is 4992 equal 101
I want maximum magnitude in that frequency be 4992 but for 94dB adc be 800
How can i change ?
I decrase gain but the adc maximum is decrase
Hi Reza,
> How can i do it?
the “fht_mag_log” function returns the magnitude already at log scale. So it is essentially decibels. You just need to calibrate it.
> How can i change ?
I don’t know how you calculate the magnitude so I don’t know.
Would like to ask for some tips on best way to analyze this signal. I was not able to get the FHT and Analog-input sub-program to work reliably.
I suspect my signal quality is bad and I need process it into a strong square signal. This is a doppler signal from a small radar sensor at 1-20 kHz and has normally only 6-20 peaks (waves) within a 1-3ms period.
Is there a preferred “sine to square wave: method? Do you recommend FHT/FFT or some sort of averaging, or other math? Thank you.
What was the output of the MeasureAnalog function? What was the output of the FHT?
Signal looks good in the photo of the scope.
Hi Arik,
first of all your article is great! I would to know if I can use your script with these sound sensors:
1. LM386
https://www.waveshare.com/sound-sensor.htm
2. LM358
https://www.seeedstudio.com/Grove-Sound-Sensor-Based-on-LM358-amplifier-Arduino-Compatible.html
Thank you so much!
Hi Max,
These are both amplifier modules with an analog output but it is not clear what their DC bias is. It might even be dynamic in which case it complicates the software or requires you do perform additional analog processing with extra passive components.
If you have an oscilloscope you can check the output of the modules.
I suggest to use the MAX4466 because it has a fixed DC bias of VCC/2, which means that a level of “0” in the input will be 3.3V/2 .
Hi Arik,
all the modules have a fixed gain. The LM386 has a fixed gain to 20 and it seems to have a Vout = VCC/2:
https://www.electrosmash.com/lm386-analysis
Can you think?
If their bias is half the supply voltage then I think it should be good with the code in this post.
Didn’t test them myself so you will need to do your own testing.
Thanks Arik!
Hello Arik,
thanks for your good explanation.
I downloaded the FHT library and copy/pasted the code and connected the mic (KY-038) to the AREF. Unfortunately, I only get something like this in the serial monitor “17:25:14.352 -> Time: 213 Amp: Max: 99% Avg: 99% RMS: 142% dB: -0.017” nothing with Hz. Do you have an idea why?
Thanks in advance
Hi Alex,
You should not connect the mic to AREF. The signal should go to A0. The AREF is the reference voltage for the ADC. Read the article for more details.
Once all is connected correctly, you can use “MeasureAnalog” to troubleshoot the level of the signal.
I believe the “KY-038” is just a signal detector and its analog output might be too weak or not biased correctly. See the module I recommend in the article.
Hello Arik,
thank you for your quick reply.
I use an Arduino Nano 3.0 and connected everything as stated in you description above. Despite, I connected the + from the microphone (KY-038) to +5V. I commented “#define Use3.3” and uncommented “MeasureFHT()” as I want to “break” down the sound into frequencies. Unfortunately, I only get strange output in serial monitor. Should I comment/uncomment anything else?
Hi Alex,
If you comment out “#define Use3.3” but connect something to the AREF pin you are possibly damaging your board by shorting VCC to whatever you connect to AREF.
See warnings in: https://cdn.arduino.cc/reference/en/language/functions/analog-io/analogreference/
Before you use FHT you need to make sure your “MeasureAnalog” makes sense. Walk before you run.
My comments about the KY-038 still stand.
Hi Arik,
glad to see that this issue is still active :-). I’ve stumbled across it while – more or less idly for the moment – speculating whether a light organ (an early precursor of a graphic spectrum analyzer 🙂 ) implementation could run on an Arduino. That specific question seems to have been answered, thanks to you.
But your specific implementation triggered a follow-up question: are you aware of any modification of your library that uses a pointer to an array instead of a fixed array? I’d like to keep the sampling running continously, storing the values in the interrupt, but that ouwld mean to use some sort of double buffering for the smaple values (since I obviously shouldn’t use the working array while FHT is working on it…).
Background: even if the sample rate of the Arduino is rather limited (I’m aware that there are Arduinos with I2s, I just don’t want to go there), I don’t like to miss any peaks because they might fall into those ~2 ms(?) of processing time.
If you’re not aware of any mods in this direction, I’ll have to wrangle the source code myself. Probably with some hideous address shoveling, hopefully outside of the FHT library.
Hey Markus,
Glad you are finding this interesting/useful.
The FHT library is not mine and it uses a fixed static buffer. This makes it difficult to implement double buffering unless you modify the library or find another. Both options are feasible.
What I have done in another project to reduce the gap between measurements is to store ADC readings in a buffer using an interrupt. Then, once the buffer is full, copy it into the FHT buffer and restart data collection. You can then perform FHT while collecting more ADC data. You miss just a tiny bit while doing the memcpy.
That was a commercial project so I can’t share code unfortunately but based on your question I do believe you can implement this easily.
Personally, nowadays, I would advice to use an ESP32 with I2S for anything serious. This is just a demo project trying to push the envelope for the Arduino Uno while trying to keep it as simple as possible.
Thanks – yes, that’ll work as a fallback. Yes to the ESP32 (for anyone else who happens to read this), too, if this were a serious project.
Hi, learned a lot from your post. I am sampling signals from a generator (CD4060) and its reflection for soil sensor with original and reflected signal read through analog in NucleoL452 on arduino ide. I get output/input as in the picture. I want to measure the rising/falling time (usually called the 90% time). Will this part of your code giving the span be enough?
void MeasureAnalog(){
long signalAvg = 0, signalMax = 0, signalMin = 1024, t0 = millis();
for (int i = 0; i < MicSamples; i++)
{
int k = analogRead(MicPin);
signalMin = min(signalMin, k);
signalMax = max(signalMax, k);
signalAvg += k;
}
signalAvg /= MicSamples;
// print
Serial.print("Time: " + String(millis() - t0));
Hi Riaz,
Rising and falling time sounds like something on the x axis (time). Span is a metric on the y axis (intensity/amount). So I don’t think it is the same. You will need to write a more elaborate algorithm to measure the 90% position and the 0% position and then to calculate the time between them.
Thanks for all the good work and explanations.
dB = 20.0*log10(soundVolRMSflt/AmpMax); does not incorporate the MAX4466 microphone sensitivity of 44 dBV = 6.31 mv/Pa, and the three gain levels of 25 x = +27.9 dB = 0.15 V, 75 x = +37.5 dB = 0.473 V, 125 x = +41.9 dB = 0.785 V one can select via the tiny trim-pot. How should these two factors, microphone sensitivity and gain, be implemented in the dB(SPL) formula? Thanks!
Hi Arik, very interesting! I am trying to use your code on Arduino Nano Every, but the IDE gives me many compilation errors probably due to the different chip. It complains about ADCSRA, ADMUX, DIDR0,.. saying “..was not declared in this scope”. I guess I should change the register names. Can you suggest me what to do? Thanks
Hi Anton,
This is an article from 2016 and it assumes an Arduino Nano or Uno with an ATmega328 MCU.
The Arduino Nano Every will have an ATMega4809 MCU which I am not familiar with but I assume is not backward compatible.
The simplest thing I can suggest is to get a board with an ATmega328. Otherwise you need to read the datasheets of the two MCUs and map any ADC/timer registers from the old one to the new one. There is a small chance that it can’t be mapped if the new MCU has more limited ADC/timer capabilities than the old one.
You might also look at https://forum.arduino.cc/t/adc-register-nano-every/860146 for additional reading.
Hi Arik,
thank you very much.
I’ll follow your advice and opt for a board based on ATmega 328,
it looks much easier than trying to adapt the code!
Hi,this is very useful information, thank you. People have suggested I use FFT for my project. I am a beginner, trying to make a device to record the sound from several machines running in close proximity to each other, save the pattern, then keep monitoring the sound and bring up an alert, with the frequency mentioned, when any frequency increases in volume constantly for more than 10 minutes – to detect a failing bearing etc.
Hi Arik! I have a question: I’m working on a school project, and I need to use an Arduino ESP32 board to create a system that measures sounds throughout the day, including their dBSPL and frequencies. I’m not sure which microphone I should use. Could you please help me?
Thank you!!
Hi ILM,
With the ESP32, you might want to try one of the microphones with a digital I2S output.
See this video for more info: https://www.youtube.com/watch?v=3g7l5bm7fZ8
Thanks!!