Lately I have been experimenting with Software Defined Radio, SDR, which is a software-based radio signal processing system. I find this field intriguing. I can capture all kinds of signals in the air and get a better understanding of how technologies and gadgets around me operate. During my exploration of SDR I discovered one tool that I must tell you about, Fosphor. One reason I am so excited to tell you about Fosphor is that I discovered some features which are not initially obvious.
Fosphor is part of GNU Radio, an SDR software package, and can be used as a block in GNU Radio flow-graphs as well as on its own (sort of). It is getting its name from Phosphor, materials that exhibit slow decay of light, which are used in radar screens and CRT displays. Fosphor is essentially a spectrum analyzer, but it is a beautiful one, a convenient one and very suitable for real-time and burst signal applications. This project’s main developer is Sylvain Munaut, who is working on this as part of the Osmocom project. This goes without saying, but Fosphor and GNU Radio are free, open source projects licensed under the GPL license.

Fosphor has 3 UI elements:
- Live spectrum – a red line showing frequencies of the signal in the window
- Waterfall – the bottom part of the window showing frequencies in time on the time axis
- Histogram – the top part of the window showing frequencies in time as a histogram
The live spectrum and waterfall are pretty standard, though nicely done, detailed, responsive and clearly colored. The histogram on the other hand is more interesting. As explained in the author’s presentation, it “charges” and “discharges” over time, which makes it easy for human to notice short bursts of signal. It is much like a “fade-out” that keeps signals on the display, signals that would disappear with other presentation methods.
All this “goodness” is implemented with GPU acceleration support, it runs on the OpenCL framework and can use CPU implementations if a proper GPU one is missing. You might need a recent CPU as there could be ones that are too old to support this new technology. This efficient implementation allows for handling very large signals that are otherwise too CPU intensive to visualize. I only tested this with a RTL-SDR so it wasn’t a concern for me, but those among you who are hardcore will appreciate this.
Additional features
But wait, this is not all. Fosphor can also be controlled by keyboard and has some additional features that hide in plain sight. The component has no UI controls to hint that additional capabilities exist and the documentation is lacking on some product pages. This led me to stumble upon the very useful Zoom, Pause and Scale features.
- Zoom splits the display vertically and lets you select a narrow frequency band of interest.
- Pause stops processing and lets you closely examine an interesting signal before it scrolls away.
- Scale changes the dB scale and offset so you can hide away noise and focus on what is interesting to you.
Zoom and Scale options
The key shortcuts/bindings are:
z:      toggle zoom mode
a/d:    move zoom frequency down/up
s/w:    adjust zoom width
q/e:    adjust screen split between waterfall and fft/histogram
space:  pause display
(left)/(right):  adjust dB/div
(up)/(down):     adjust dB offset
Standalone usage
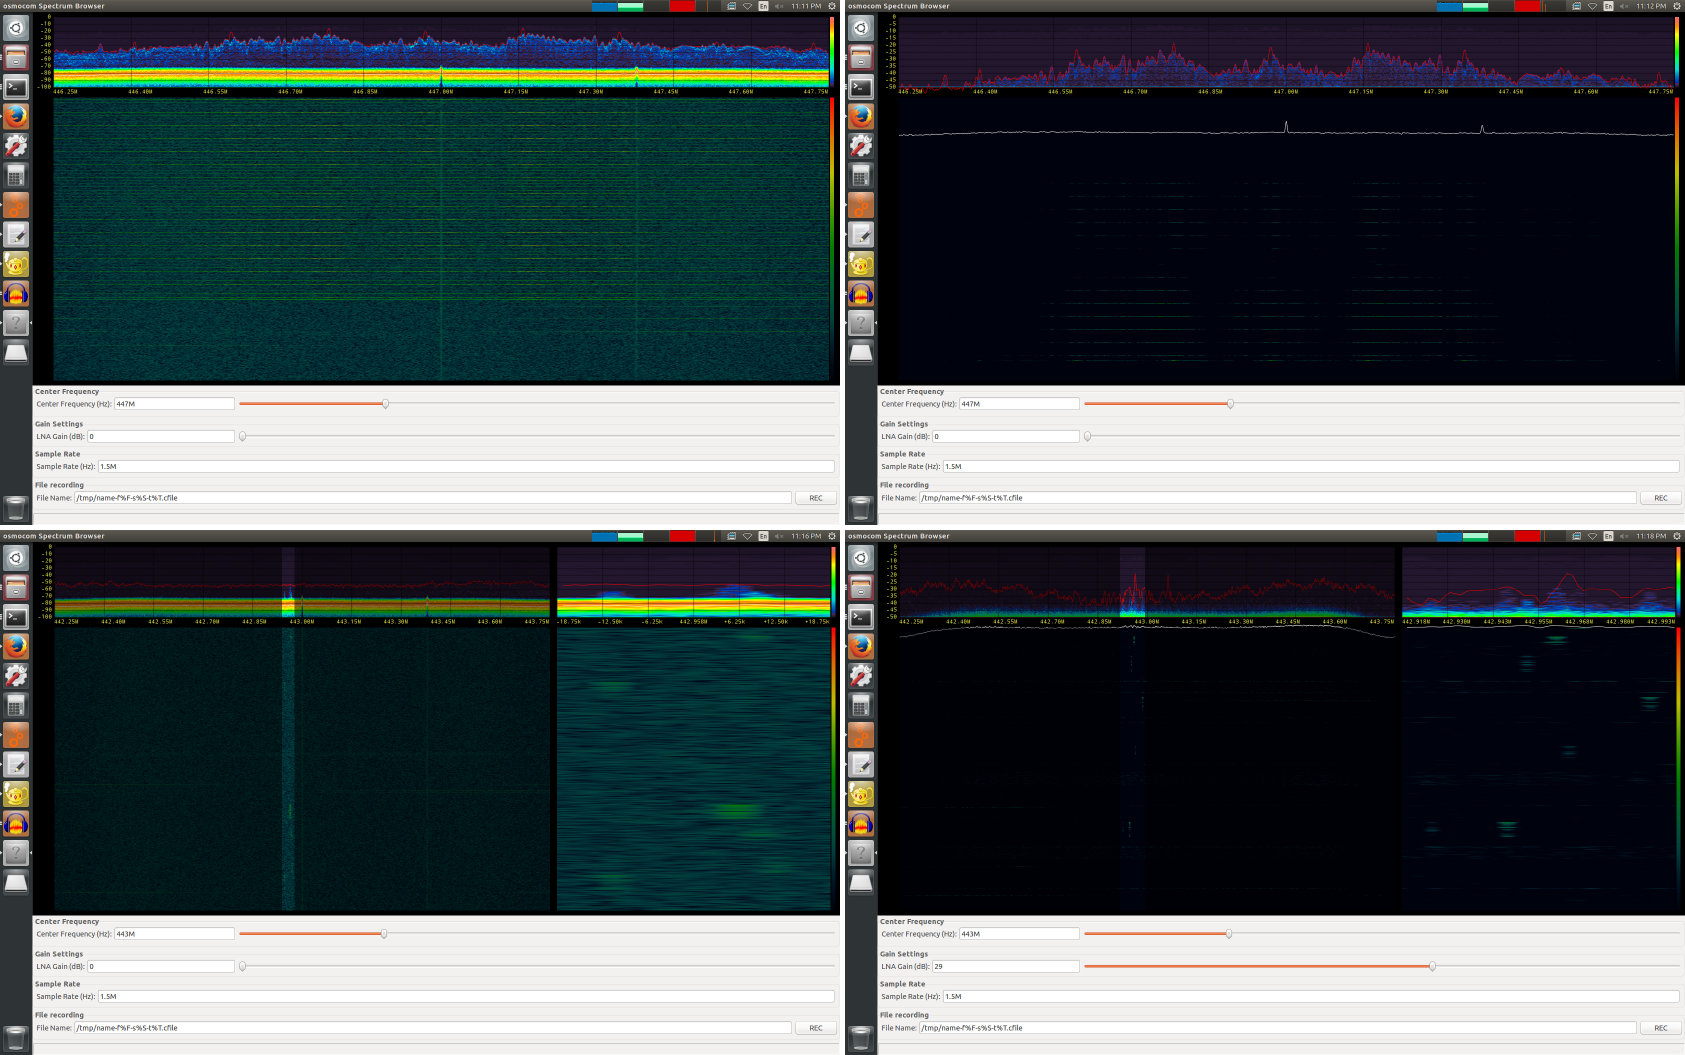
Fosphor is available as an option in osmocom_fft. osmocom_fft is a spectral analyzer tool that is implemented on top of a GNU Radio framework and that can be launched from the command line. It combines a visualizing panel with tuning and gain UI controls. When osmocom_fft is launched with the “-F” option it will use Fosphor instead of the default live spectrum visualizing panel. Using Fosphor in this way expands Fosphor with UI controls to set frequency, gain, sample rate, etc. Great alternative to Gqrx as long as all you need is to do scanning.
In fact, most of the screenshots you see above are Fosphor as part of the osmocom_fft utility. Note that Fosphor is just the colorful waterfall and histogram part of the UI.
Summary
Thanks to all the developers for making this great tool for the community as well as the other projects in the SDR space.
Thanks a lot for this blog post, had no idea all these keyboard commands existed!
Hoi, updated link to the slides:
https://static.squarespace.com/static/543ae9afe4b0c3b808d72acd/543aee20e4b09162d086344e/543aee20e4b09162d086345c/1382364069083/grcon13_munaut_fosphor.pdf
Thanks Christian!